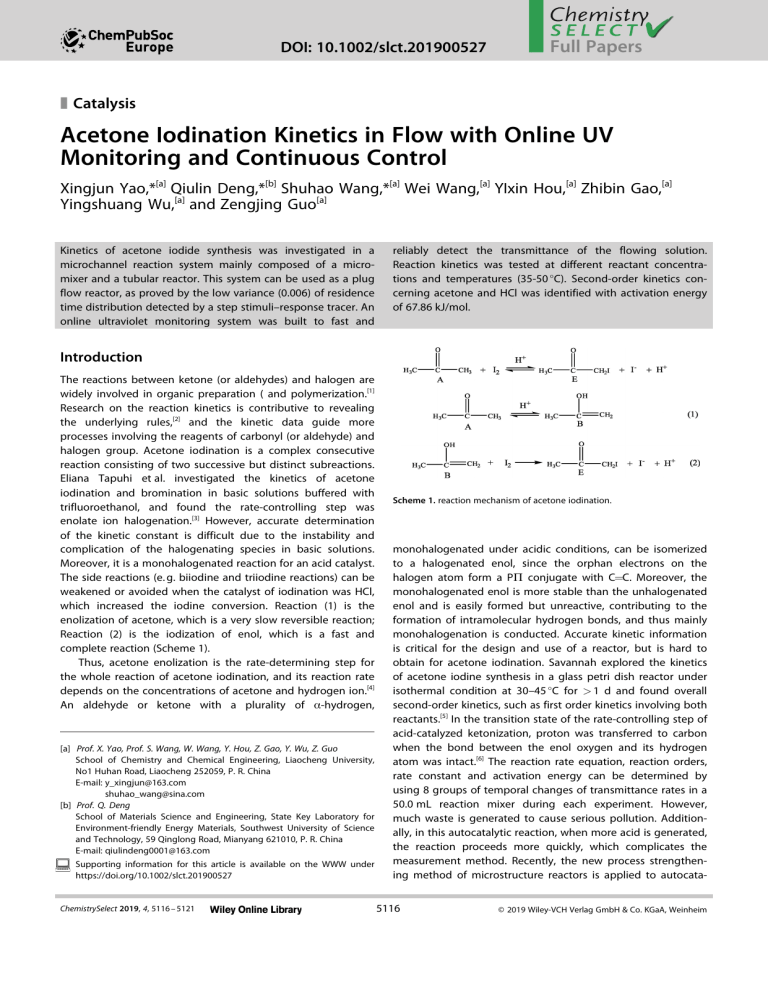
DOI: 10.1002/slct.201900527 1 2 3 4 5 6 7 8 9 10 11 12 13 14 15 16 17 18 19 20 21 22 23 24 25 26 27 28 29 30 31 32 33 34 35 36 37 38 39 40 41 42 43 44 45 46 47 48 49 50 51 52 53 54 55 56 57 Full Papers z Catalysis Acetone Iodination Kinetics in Flow with Online UV Monitoring and Continuous Control Xingjun Yao,*[a] Qiulin Deng,*[b] Shuhao Wang,*[a] Wei Wang,[a] YIxin Hou,[a] Zhibin Gao,[a] Yingshuang Wu,[a] and Zengjing Guo[a] Kinetics of acetone iodide synthesis was investigated in a microchannel reaction system mainly composed of a micromixer and a tubular reactor. This system can be used as a plug flow reactor, as proved by the low variance (0.006) of residence time distribution detected by a step stimuli–response tracer. An online ultraviolet monitoring system was built to fast and reliably detect the transmittance of the flowing solution. Reaction kinetics was tested at different reactant concentrations and temperatures (35-50 °C). Second-order kinetics concerning acetone and HCl was identified with activation energy of 67.86 kJ/mol. Introduction The reactions between ketone (or aldehydes) and halogen are widely involved in organic preparation ( and polymerization.[1] Research on the reaction kinetics is contributive to revealing the underlying rules,[2] and the kinetic data guide more processes involving the reagents of carbonyl (or aldehyde) and halogen group. Acetone iodination is a complex consecutive reaction consisting of two successive but distinct subreactions. Eliana Tapuhi et al. investigated the kinetics of acetone iodination and bromination in basic solutions buffered with trifluoroethanol, and found the rate-controlling step was enolate ion halogenation.[3] However, accurate determination of the kinetic constant is difficult due to the instability and complication of the halogenating species in basic solutions. Moreover, it is a monohalogenated reaction for an acid catalyst. The side reactions (e. g. biiodine and triiodine reactions) can be weakened or avoided when the catalyst of iodination was HCl, which increased the iodine conversion. Reaction (1) is the enolization of acetone, which is a very slow reversible reaction; Reaction (2) is the iodization of enol, which is a fast and complete reaction (Scheme 1). Thus, acetone enolization is the rate-determining step for the whole reaction of acetone iodination, and its reaction rate depends on the concentrations of acetone and hydrogen ion.[4] An aldehyde or ketone with a plurality of α-hydrogen, [a] Prof. X. Yao, Prof. S. Wang, W. Wang, Y. Hou, Z. Gao, Y. Wu, Z. Guo School of Chemistry and Chemical Engineering, Liaocheng University, No1 Huhan Road, Liaocheng 252059, P. R. China E-mail: y_xingjun@163.com shuhao_wang@sina.com [b] Prof. Q. Deng School of Materials Science and Engineering, State Key Laboratory for Environment-friendly Energy Materials, Southwest University of Science and Technology, 59 Qinglong Road, Mianyang 621010, P. R. China E-mail: qiulindeng0001@163.com Supporting information for this article is available on the WWW under https://doi.org/10.1002/slct.201900527 ChemistrySelect 2019, 4, 5116 – 5121 Scheme 1. reaction mechanism of acetone iodination. monohalogenated under acidic conditions, can be isomerized to a halogenated enol, since the orphan electrons on the halogen atom form a PΠ conjugate with C=C. Moreover, the monohalogenated enol is more stable than the unhalogenated enol and is easily formed but unreactive, contributing to the formation of intramolecular hydrogen bonds, and thus mainly monohalogenation is conducted. Accurate kinetic information is critical for the design and use of a reactor, but is hard to obtain for acetone iodination. Savannah explored the kinetics of acetone iodine synthesis in a glass petri dish reactor under isothermal condition at 30–45 °C for > 1 d and found overall second-order kinetics, such as first order kinetics involving both reactants.[5] In the transition state of the rate-controlling step of acid-catalyzed ketonization, proton was transferred to carbon when the bond between the enol oxygen and its hydrogen atom was intact.[6] The reaction rate equation, reaction orders, rate constant and activation energy can be determined by using 8 groups of temporal changes of transmittance rates in a 50.0 mL reaction mixer during each experiment. However, much waste is generated to cause serious pollution. Additionally, in this autocatalytic reaction, when more acid is generated, the reaction proceeds more quickly, which complicates the measurement method. Recently, the new process strengthening method of microstructure reactors is applied to autocata5116 © 2019 Wiley-VCH Verlag GmbH & Co. KGaA, Weinheim Full Papers 1 2 3 4 5 6 7 8 9 10 11 12 13 14 15 16 17 18 19 20 21 22 23 24 25 26 27 28 29 30 31 32 33 34 35 36 37 38 39 40 41 42 43 44 45 46 47 48 49 50 51 52 53 54 55 56 57 lytic reactions, such as biological process,[7] halogenation[8] and nitrification reaction.[9] Pompano et al. showed the mixing rate affects autocatalytic systems in two ways: 1), if the initial activator concentration is near the threshold, both the complex biochemical reaction of blood clotting and the chemical analog can be started or stopped by changing the mixing rate; 2), if it is far above the threshold, these reactions can be decelerated by rapid blending.[6] They also explained the underlying mechanism by using the Damkohler number to denote the balance between reaction and mixing rates, and validated through 2-D numerical simulation of threshold kinetics in an irregularly mixed plug.[5] Niedl et al. increased the yields of nitrophenols from phenol nitration in a microreactor irrespective the use of CH3CO2H, and attributed the increase to the improvement in heat exchange, mixing rate and radical migration in a fixed volume. Besides the small reacting volumes at any time, the exothermic reactions can be better controlled by the nonstop phenol nitration in a microreactor. The occurrence of nitration within the microreactor can be ensured only by more concentrated conditions and absence of solvent and H2SO4 or CH3CO2H. Thus, the improved yields and process safety make the microreactor technology applicable to autocatalytic reactions such as industrial nitration.[7] New methods based on such improvement without causing extra problems are needed.[10a–h] Yao et al. raised the yield of acetic acid esters to 70.1%, 74.0%, 92.2% and 97.2% in a microchannel reactor with the presence of ethanol, methanol, n-butanol and npropanol, respectively, during the 14.7 min of residence.[11] Aromatic nitration of acetyl guaiacol is highly exothermic and fast, and can be better controlled at high efficiency in the microreactor due to the acceleration of mixing and heat transfer. The yield of the desired 5-nitroguaiacol was 90.7% under the optimized conditions of 40% nitric acid, a nitric acidacetyl guaiacol molar ratio of 2.6, temperature at 120 °C, and residence time of 2 min. The microreactor outperformed the traditional batch reactor owing to the higher yield and selectivity, much shorter reaction time, and less use of nitric acid.[12] Here, this need was addressed by describing a kinetic determination method using a continuous-flow microchannel reactor. The microchannel reactor was developed to promote the acetone iodination under acid catalyzed conditions. Then the kinetics of acetone iodination in the microchannel reactor as well as the residence time distribution was studied. A comprehensive mathematic kinetic model was built based on the results. stay on one element reaction of iodinated acetone; Otherwise, the reaction does not. The test wavelength changes with the iodine concentration, which thus should not range too largely. The reading of the absorbance should be in a reasonable range so as to reduce the error caused by the reader. When the concentration of each substance is selected, the reaction time of each reaction system should not be too long. Meanwhile, high HCl concentration and rapid reaction rate make few measurement points available and increase the random error; however, the smaller solution concentration leads to the slower reaction rate and thereby prolongs the experimental time. Considering the relationship between iodine consumption rate and iodine concentration as well as the range of absorbance measurement, we set the test wavelength at 565 nm and the concentrations of acetone(Figure 1a), acid and iodine at 0.1-0.4, Results and Discussion Selection of test wavelength and solution oncentration The main contents of kinetic experiments are to obtain a series of reliable data with experimental methods and to establish a kinetic equation based on these data. Generally, the reaction rate of acetone iodization is measured by spectrophotometry. When the iodine concentration is far smaller than the acetone and acid concentrations (Cacid, Cacetone @ CI2), the reaction will ChemistrySelect 2019, 4, 5116 – 5121 Figure 1. Absorbance of different iodine solution concentrations. (a) Absorbance versus wavelength; (b) Calibration curve of TU1810 ultraviolet visible spectrophotometer 0.1-0.3 and 0.0001-0.003 mol⋅L 1 respectively.[13] We also provide the calibration curve to ensure that the concentration of 5117 © 2019 Wiley-VCH Verlag GmbH & Co. KGaA, Weinheim Full Papers 1 2 3 4 5 6 7 8 9 10 11 12 13 14 15 16 17 18 19 20 21 22 23 24 25 26 27 28 29 30 31 32 33 34 35 36 37 38 39 40 41 42 43 44 45 46 47 48 49 50 51 52 53 54 55 56 57 iodine solutions does not saturate the detector of the UV-Vis spectrometer (Figure 1b). (Adj.R-square is 0.9978). Determination of residence time distribution (RTD) Any ideal plug flow reactor (PFR) can be verified by RTD, which measured using a stimuli– response tracer here. The tracer was erioglaucine disodium salt (EDS; CAS No. 3844–45-9), a reactive brilliant blue dye, and its levels were detected by an ultraviolet visible (UV–vis) spectrophotometer at 629 nm. The F curve of RTD in the reaction system was identified using a step input. The reaction system was first fed with pure water and an EDS water solution separately through two syringe pumps. When the EDS concentration in the effluent became constant and zero, the EDS pump was stopped and restarted, respectively. Moreover, the liquid was sampled at the outlet every 1 min. The F curve shows the temporal ratio of EDS concentration in the effluent to that in the feed (Figure 2). 1 FðqÞ ¼ ½1 2 � erf � pffiffiffiffiffi ð1 qÞ Bo pffiffiffiffiffi �ð4Þ 4q The residence time function was deduced from the response signal of an auto-induced step function of tracer concentration (Figure 2). Bo was determined by least-square fitting the response signal curve. Then the dispersed plug flow model was numerically fitted with Bo as the only parameter, and was optimized at Bo of 13200. Surprisingly, this result indicates low axial dispersion and suggests the microchannel reactor is PFR. Effect of feed flow rate on the synthesis of acetone iodination The same flow rate of acetone solution and the HCl and I2 mixed solution was investigated with a 0.4 mol/L acetone, 0.2 mol/LHCl, 0.006 mol/LI2, a liquid hourly space velocity (LHSV) of 313.52 h 1, and a reaction temperature of 45 °C. The results are presented in table 1. It shows that with the increase Table 1. Iodination reaction at a given LHSV of 313.52 h 1 in the microchannel delay loop reactor with various flow rates and lengths of the microchannel reactor Figure 2. F curve of RTD measured by a step stimuli–response tracer method at total flow rate of 4.0 mL/min. Based on the results, the residence time at the stainless steel tube length of 5 m was averaged to be 57.41 s, with the variance (σ2θ) of 0.006. The residence time behavior in flow channels was illustrated using a reported dispersion model.[14] Herein, the backmixing degree was denoted by the dimensionless Bodenstein number Bo: Bo ¼ uL Dax (3) where the dispersion coefficient Dax reflects the influence of axial back mixing in one parameter. With Eq. 3, the F-curve under open boundary conditions (i. e., dispersion continuity)[15] can be illustrated as follows: ChemistrySelect 2019, 4, 5116 – 5121 Each feed flow rate (ml/min) Length of microchannel delay loop (m) Each feed flow rate (ml/min) 1.0 1.5 2.0 2.5 3.0 1.0 2.50 3.75 5.00 6.25 7.50 2.50 46.3 51.2 58.7 60.4 62.8 46.3 of the total flow rate from 1.0 to 1.5 to 2.0 mL/min (corresponding to the increase of microchannel length from 2.50 to 3.75 to 5.00 m), the transmittance increases sharply with an increment of 7.5%. Further increase of the flow rate to 2.5 and to 3.0 mL/ min, results in the slightly increase of transmittance. This may be ascribed to the fact that the shear stress inside the pipeline can eliminate the concentration gradient and temperature gradient with the increase of the flow rate. The feed flow rate of 2.0 mL/min was selected by the subsequent kinetic experiment. Determination of reaction order, reaction rate constant and active energy A reliable kinetic model based on the reaction mechanism (Eqs. (1) and (2)) was built and used to uncover the kinetics of acetone iodination. The reaction order of I2, which did not severely affect the reaction performance, was ignored in the kinetic modeling.[13b] Consequently, the newly-designed kinetic model involved reactants acetone (A) and HCl, which reacted to form intermediate B, which was further iodinatized into acetone iodine (E). Based on the reactions under the above 5118 © 2019 Wiley-VCH Verlag GmbH & Co. KGaA, Weinheim Full Papers 1 2 3 4 5 6 7 8 9 10 11 12 13 14 15 16 17 18 19 20 21 22 23 24 25 26 27 28 29 30 31 32 33 34 35 36 37 38 39 40 41 42 43 44 45 46 47 48 49 50 51 52 53 54 55 56 57 conditions, the rate-determining step was acetone enolization. Therefore, a pre-equilibrium among acetone, I2 solution and HCl could be established and was rarely affected by the very slow reaction rate from A to B. Thus, the reaction rate r and rate constant of A and HCl reaction can be described as follows: dCA dCE ¼ ¼ k � CA � CHþ dt dt r¼ (5) According to Eq. (2), we have dCE/dt =-dCI2/dt.The change in iodine concentration could be measured by the UV spectrophotometer according to the color loss due and then the loss of iodine, since iodine was the limiting reactant when the acetone and HCl levels were excessive. If the iodine concentrations at all time points during the reaction were measured, dCE/dt can be acquired. Then integrating both sides of Eq. (5), we could derive the change of E concentration as follows, Z CE2 CE1 Z dCE ¼ Figure 3. Investigation reciprocal of temperature dependence of the -LnK of the reaction in microchannel reactor. Reaction conditions: temperature 35– 50 °C, residence time 34.35-149.27 s, 0.4 mol/L A, 0.2 mol/L H + + 0.006 mol/L I2 t2 t1 K � CA � CHþ � dt (6) CE2 CE1 ¼ K � CA � CHþ � ðt2 t1 Þ According to Lambert-Beer’s law, lgT ¼ e � l � CI2 I dC ForT ¼ ; E ¼ I0 dt (7) dCI2 ,C C ¼ CI2 1 CI2 2 dt E2 E1 (8) Substituting Eqs. (7) and (8) into Eq. (6), K can be written as follows, lgT2 lgT1 ¼ K � ðe � lÞ � CA � CHþ � ðt2 t1 Þ (9) lgT2 lgT1 1 � ðelÞ � ðt2 t1 Þ CA � CHþ (10) or K¼ In Eq. (10), ε can be calculated by substituting the transmittance of a known iodine concentration into Eq. (7), as long as the transmittance of the reactant solution at different time points was measured (Figure 3), and the A and H + concentrations were known, K can be calculated: Lnki ðTÞ ¼ Ei þLnAi RT (11) where T, Ei, R and Ai are the absolute temperature (K), activation energy (kJ⋅mol 1), universal gas constant (8.314 J⋅mol 1⋅K 1 ), and pre-exponential factor, respectively. To detect the temporal variation of reagent concentrations, kinetic assay conditions in a continuous-flow microchannel reactor were set at 35, 40, 45 and 50 °C at the A, HCl and I2 concentrations of 0.4, 0.2 and 0.006 mol⋅L 1 respectively. Other kinetic experiments in Figure 4 show the experimental data from the given conditions: ChemistrySelect 2019, 4, 5116 – 5121 Figure 4. Investigation of residence time dependence of the iodination of acetone in microchannel reactor. Reaction conditions: temperature 45 °C, residence time 34.35-149.27 s, concentrations (all mol/L): (a) 0.4 A, 0.2 H + + 0.006 I2; (b) 0.4 A, 0.4 H + + 0.006 I2; (c) 0.4 A, 0.2 H + + 0.003 I2; (d) 0.8 A, 0.2 H + + 0.006 I2; ri ¼ dð LgT%Þ 1 � ðMol=L=SÞ dt ei l (12) (ri ¼ kCaA � CbHþ � CgI2 ); α, β, γ represent the reaction orders of A, H +, I2 respectively (Eq. 13). The order of the reaction, describing the dependence of reaction rate on concentration, may be figured out by plotting transmittance from each reaction and adopting the most linear function. Reaction rate ri, rate constant ki, reaction order and correlation coefficient Ri detected at 45 °C and feed flow rates 2.0 mL/min were showed in Table 2. The k fitted at different temperatures is listed in Table 3. 5119 © 2019 Wiley-VCH Verlag GmbH & Co. KGaA, Weinheim Full Papers 1 2 3 4 5 6 7 8 9 10 11 12 13 14 15 16 17 18 19 20 21 22 23 24 25 26 27 28 29 30 31 32 33 34 35 36 37 38 39 40 41 42 43 44 45 46 47 48 49 50 51 52 53 54 55 56 57 Table 2. Kinetic rate constants, reaction rate, reaction orders and correlation coefficient of acetone Iodination (feed flows of acetone solution and the HCl and I2 mixed solution were both 2.0 mL/min) Temperature (°C) Molar concentration (mol/L) Acetone solution Mixer of HCl and I2 solution Ri ki (mol/L) 1⋅s 45 0.4 0.4 0.4 0.8 -0.99901 -0.99935 -0.99900 -0.99568 9.12E-04 8.33E-04 7.38E-04 10.11E-04 0.2, 0.006 0.4, 0.006 0.2, 0.003 0.2, 0.006 Table 3. Volume flows of acetone solution and the HCl + I2 mixed solution at 2.0 mL/min Temperature (°C) Molar concentration (mol/L) Acetone Mixer of HCl and I2 solution solution Ea (KJ/ mol) Ai (mol/ L) 1⋅s 1 35-50 0.4 0.4 0.4 0.8 67.8637 5.527E7 0.2, 0.006 0.4, 0.006 0.2, 0.003 0.2, 0.006 Reaction rate equation and the possible course of the reaction are as follows: ri = k⋅CA⋅CH + r a¼ Lgð r14 Þ C Lgð CA1 Þ A4 r r ;b ¼ Lgð r12 Þ C þ Lgð CHH 12 Þ ;r ¼ þ Lgð r13 Þ C2 Lgð CII 12 Þ (13) 2 r¼ 1 ri (mol/L)⋅s 1.52E-05 3.33E-05 1.47E-05 4.05E-05 1 α,β,γ α = 0.9890, β = 1.0363, γ = 0.0957 dCE K1 K2 KCA CHþ CI2 ¼ � k1 kCA CHþ ¼ Ktotal CA CHþ dt K 1 CHþ þK2 CI2 (20) If the reaction rate of enol D with I2 is much larger than that with H +, k2⋅CI2 � k-1⋅CH +, then Eq. (20) can be approximated as r = dCE/dt � k1kCACH + = Ktotal⋅CA⋅CH +, which is consistent with the experimental results. When deducing rate equation from reaction mechanism, steady-state approximation has more general applicability than the equilibrium state hypothesis, and more reflects the nature of the reaction mechanism.[16] Results show the acetone iodination rate is consistent between experiment and calculation. Further, it is foreseeable that as the number of carbon atoms in the alkyl chain of the ketone increases, the volume steric hindrance increases, the water solubility of the ketone deteriorates (for example, methyl ethyl ketone, 2-pentanone), and the inorganic acid catalytic system of the ketone in the aqueous medium convers to organic acids catalytic system in organic media, the reaction mechanism will be more complicated.[17] ð14Þ Conclusions ð15Þ ð16Þ Reaction (14) reaches equilibrium quickly, and its equilibrium constant is K: CB ¼ KCA CHþ (17) dCD ¼ k1 CB ½k 1 CHþ þk2 CI2 �CD dt (18) dCE ¼ k2 CI2 CD dt (19) A novel continuous-flow microchannel reaction system (containing a micromixer and a microchannel reactor) was designed for the well-controlled and efficient acetone iodination, and was confirmed as a plug flow reactor through RTD measurement. The kinetics of the fast and endothermic acetone iodination was explored in a case study. The iodination conversion was rapidly and accurately measured online by a UV spectrometer. This microchannel reaction system is feasible for studying the kinetics of fast reaction with color change. The iodination rate can be calculated from r = 5.527E7 exp ( 8.16/ T) CACH +. The reaction rate is independent of the iodine and thus can be studied under presence of excessive acetone and HCl. The reaction order and reaction activation energy were determined to set up the reaction kinetic equation. In all, this study provides ideas for automatic control of other halogenation reactions of aldehydes and ketones, which will be studied by our team in the future. Supporting information summary Readers can read the experimental section include the chemicals, materials and experimental processes Combining Eqs. (17) (18) (19), and using the steady-state hypothesis dCD/dt = 0, we have: ChemistrySelect 2019, 4, 5116 – 5121 5120 © 2019 Wiley-VCH Verlag GmbH & Co. KGaA, Weinheim Full Papers 1 2 3 4 5 6 7 8 9 10 11 12 13 14 15 16 17 18 19 20 21 22 23 24 25 26 27 28 29 30 31 32 33 34 35 36 37 38 39 40 41 42 43 44 45 46 47 48 49 50 51 52 53 54 55 56 57 Acknowledgements The authors are very grateful to acknowledge National Natural Science Foundation of China (Grant No.21706109) and Foundation of Liaocheng University (Grant No. 318011508, 26312160520) for financial support. Conflict of Interest The authors declare no conflict of interest. Keywords: Acetone Iodination · Kinetics · Microchannel reactor · Synthesis [1] a) J. Szudkowska-Fratczak, G. Hreczycho, P. Pawluc, Org. Chem. Front. 2015, 2, 730–738; b) M. Ehrlich, T. Carell, Eur. J. Org. Chem. 2013, 77–83. [2] M. Amatore, T. D. Beeson, S. P. Brown, D. W. C. MacMillan, Angew. Chem.Int. Edit. 2009, 48, 5121–5124. [3] E. Tapuhi, W. P. Jencks, J. Am. Chem. Soc. 1982, 104, 5758–5765. [4] L. Uson, M. Arruebo, V. Sebastian, J. Santamaria, Chem. Eng. J. 2018, 340, 66–72. [5] S. Carroll, A. Hughes, chemistry and physics lab, Department of Chemistry University of Tennessee, Knoxville, TN, 2014. [6] G. E. Lienhard, T.-C. Wang, J. Am. Chem. Soc. 1968, 91, 1146–1153. [7] R. R. Pompano, H. W. Li, R. F. Ismagilov, Biophys. J. 2008, 95, 1531–1543. [8] R. Niedl, I. Berenstein, C. Beta, Phys. Chem. Chem. Phys. 2016, 18, 6451– 6457. ChemistrySelect 2019, 4, 5116 – 5121 [9] a) L. Ducry, D. M. Roberge, Angew. Chem.-Int. Edit. 2005, 44, 7972–7975; b) N. Kockmann, D. M. Roberge, Chem. Eng. Technol. 2009, 32, 1682– 1694. [10] a) F. Zhou, B. Y. Zhang, H. C. Liu, Z. H. Wen, K. J. Wang, G. W. Chen, Org. Process Res. Dev. 2018, 22, 504–511; b) C. C. Du, J. S. Zhang, G. S. Luo, Aiche J. 2018, 64, 571–577; c) J. Yue, Catal. Today 2018, 308, 3–19; d) L. Tamborini, P. Fernandes, F. Paradisi, F. Molinari, Trends Biotechnol. 2018, 36, 73–88; e) A. Tanimu, S. Jaenicke, K. Alhooshani, Chem. Eng. J. 2017, 327, 792–821; f) A. Kecskemeti, A. Gaspar, Talanta 2018, 180, 211–228; g) X. J. Yao, Y. Zhang, L. Y. Du, J. H. Liu, J. F. Yao, Renew. Sust. Energ. Rev. 2015, 47, 519–539; h) A. J. Bissette, S. P. Fletcher, Angew. Chem.-Int. Edit. 2013, 52, 12800–12826. [11] X. J. Yao, J. F. Yao, L. X. Zhang, N. P. Xu, Catal. Lett. 2009, 132, 147–152. [12] C. Y. Zhang, J. S. Zhang, G. S. Luo, J. Flow. Chem. 2016, 6, 309–314. [13] a) D. Bascone, P. Angeli, E. S. Fraga, Nucl. Eng. Des. 2018, 332, 162–172; b) G. Yueshu, Basic Physical Chemistry Experiment (III). Third edition, Chemical Industry Press, Beijing, 2004. [14] N. Zaborenko, M. W. Bedore, T. F. Jamison, K. F. Jensen, Org. Process Res. Dev. 2011, 15, 131–139. [15] P. Danckwerts, Chem. Eng. Sci. 1953, 2, 1–13. [16] D. G. Han, Z. D. Gao, P. L. Gao, Physical Chemistry. Second edition, Higher education press, Beijing, 2009. [17] a) J. F. W. Keana, R. R. Schumaker, Tetrahedron Lett. 1970, 26, 5191–5194; b) R. Becker, S. van den Broek, P. J. Nieuwland, K. Koch, F. Rutjes, J. Flow. Chem. 2012, 2, 87–91. Submitted: February 8, 2019 Accepted: April 11, 2019 5121 © 2019 Wiley-VCH Verlag GmbH & Co. KGaA, Weinheim
