Charpy Impact Test Lab Report: Material Properties & Temperature Effects
advertisement

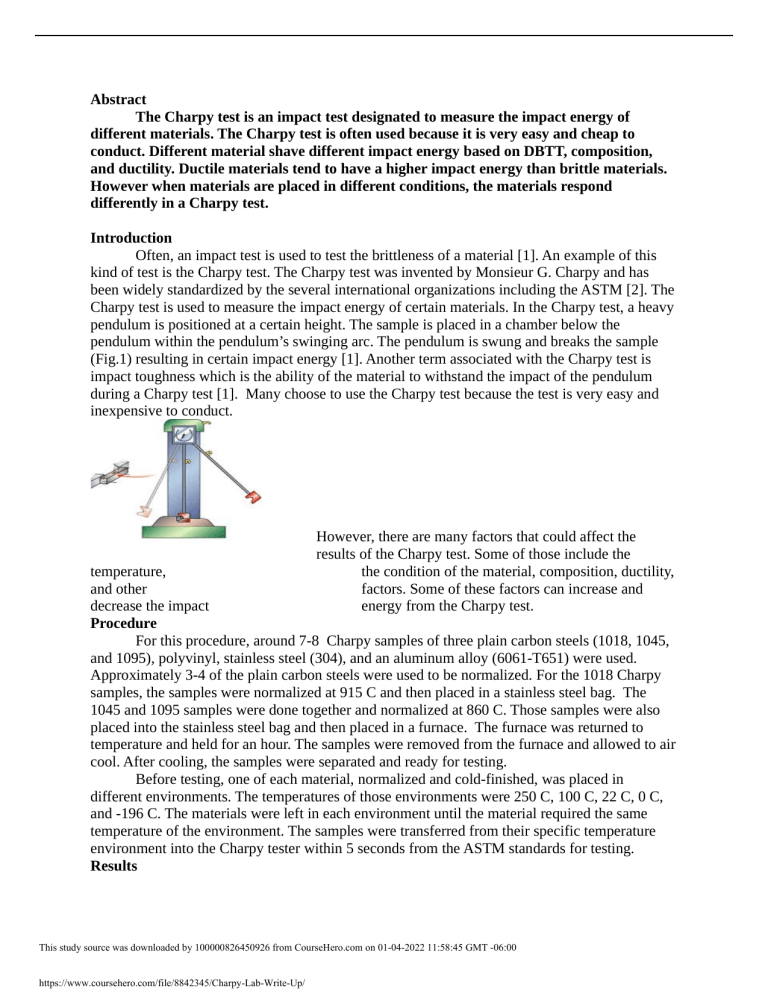
Abstract The Charpy test is an impact test designated to measure the impact energy of different materials. The Charpy test is often used because it is very easy and cheap to conduct. Different material shave different impact energy based on DBTT, composition, and ductility. Ductile materials tend to have a higher impact energy than brittle materials. However when materials are placed in different conditions, the materials respond differently in a Charpy test. Introduction Often, an impact test is used to test the brittleness of a material [1]. An example of this kind of test is the Charpy test. The Charpy test was invented by Monsieur G. Charpy and has been widely standardized by the several international organizations including the ASTM [2]. The Charpy test is used to measure the impact energy of certain materials. In the Charpy test, a heavy pendulum is positioned at a certain height. The sample is placed in a chamber below the pendulum within the pendulum’s swinging arc. The pendulum is swung and breaks the sample (Fig.1) resulting in certain impact energy [1]. Another term associated with the Charpy test is impact toughness which is the ability of the material to withstand the impact of the pendulum during a Charpy test [1]. Many choose to use the Charpy test because the test is very easy and inexpensive to conduct. However, there are many factors that could affect the results of the Charpy test. Some of those include the the condition of the material, composition, ductility, factors. Some of these factors can increase and energy from the Charpy test. temperature, and other decrease the impact Procedure For this procedure, around 7-8 Charpy samples of three plain carbon steels (1018, 1045, and 1095), polyvinyl, stainless steel (304), and an aluminum alloy (6061-T651) were used. Approximately 3-4 of the plain carbon steels were used to be normalized. For the 1018 Charpy samples, the samples were normalized at 915 C and then placed in a stainless steel bag. The 1045 and 1095 samples were done together and normalized at 860 C. Those samples were also placed into the stainless steel bag and then placed in a furnace. The furnace was returned to temperature and held for an hour. The samples were removed from the furnace and allowed to air cool. After cooling, the samples were separated and ready for testing. Before testing, one of each material, normalized and cold-finished, was placed in different environments. The temperatures of those environments were 250 C, 100 C, 22 C, 0 C, and -196 C. The materials were left in each environment until the material required the same temperature of the environment. The samples were transferred from their specific temperature environment into the Charpy tester within 5 seconds from the ASTM standards for testing. Results This study source was downloaded by 100000826450926 from CourseHero.com on 01-04-2022 11:58:45 GMT -06:00 https://www.coursehero.com/file/8842345/Charpy-Lab-Write-Up/ Table 1 is a summary of the materials in the different conditions and the results from the Charpy test in each condition. The 1018 material showed similar properties in the lower temperatures in how the material broke. However, the material changed from brittle to ductile in the cold-finished sample around 100°C. Fig. 2 shows how the impact energy changed in how the material. The impact energy was higher in the normalized sample than the cold finished sample. Fig. 3 compares the data for the 1045 sample. In contrast, the 1045 sample was opposite of the 1018 sample. The cold finished sample had higher impact energy than the normalized sample. Fig. 4 compares the 1095 cold finished and normalized sample. This data did not have a normal comparison with one set of data being higher than the others. The data intertwine at a certain point and the graph switch positions. Originally, the normalized sample had the higher impact energy, and then later in the graph the cold-finished sample had the higher impact energy. Fig.5 shows how the compositions of different samples affect the impact energy. Stainless steel had the overall highest impact energy followed by the aluminum alloy and the polyvinyl chloride being last. This study source was downloaded by 100000826450926 from CourseHero.com on 01-04-2022 11:58:45 GMT -06:00 https://www.coursehero.com/file/8842345/Charpy-Lab-Write-Up/ Table 1. Summary results of the Charpy test Material Temperature (°C) Impact Energy (J) -196 3.1 0 7.8 1018 CF 22 24.7 100 84.5 250 93.2 1018 N -196 0 22 100 250 2 150 60 150 150 1045 CF -196 0 22 100 250 2.1 5.9 11.7 15.1 18.4 -196 0 22 100 250 -196 0 22 100 250 -196 0 22 100 250 -196 0 22 100 -196 0 22 100 -196 0 22 100 2.6 43.2 52.7 88.3 90.3 1.4 8.3 7.1 7.5 28.2 1.2 3.2 3.6 13.8 28.1 33.9 34.6 39.7 35.2 99 100 105.2 102.2 3.3 4.3 4 12.2 1045 N 1095 CF 1095 N 6061 Al 304 SS PVC Quantitative As the temperature increased, the material became more ductile. The samples placed in the 100°C and 250°C environments formed sheer lips. The samples in lower temperature had very clean breaks making them brittle. This sample was hard to distinguish whether or not it was ductile or brittle. The two samples placed in the higher temperatures did not completely break. The samples at the temperatures lower than 100°C did not do a clean break but did break with a somewhat flat surface so those materials were brittle. The material broke in half. The material appeared to be brittle break was a clean break for most of the samples except for one. The sample placed in the 250°C became ductile because the sample formed sheer lips instead of the clean break like the other samples. The sample placed in the -196 °C environment became ductile. This sample did not have a clean break and formed sheer lips the other samples were very brittle and had very clean breaks. This material was very brittle. Each sample had a clean break. This material was very brittle throughout. Each sample had clean breaks. Aluminum is a very ductile material. None of the samples had a clean break and some of the samples formed sheer lips. Overall, this material was very ductile. Each sample had sheer lips. None of the samples had a clean break as seen with the brittle materials. This material was different from the others. The sample in the -196°C did break but the other half of the sample completely shattered. However the sample in the 100°C did not break. Figure 2 shows the difference in the impact energy between the cold-finished and normalized 1018 sample. This study source was downloaded by 100000826450926 from CourseHero.com on 01-04-2022 11:58:45 GMT -06:00 https://www.coursehero.com/file/8842345/Charpy-Lab-Write-Up/ Figure 3 shows the difference in the impact energy between the cold finished and normalized 1045 sample. Figure 4 shows the difference in impact energy between the normalized and cold finished 1095 sample. Figure 5 is to show how the different material affects the impact energy. The samples included are 6061 Al, 304 Stainless Steel, and Polyvinyl Chloride. Discussion Fig 1. shows how whether the material was cold-finished or normalized affected the different material at different temperatures. As stated in Table 1, the cold finished material began to become ductile around 100°C. The material began to reach its Ductile to Brittle Transition Temperature (DBTT) [1]. The DBTT is the temperature where the material changes from brittle to ductile failure [1]. Before reaching that temperature, the 1018 sample was brittle. However, the normalized 1018 sample did not follow the same trend. Instead, the impact energy reached the maximum amount of energy that could be recorded on the Charpy tester. The graph however does not properly display this data. The points located at the 0°C and 22°C are very strange. The point at 0°C was is very high compared to the 22°C. Reasons for this error could include the sample being mislabeled and the right sample was not used, the test was not completed with the 5 second rule standardized by ASTM, or the machine was not calibrated properly before experimentation. The graph should have shown a gradually increase to the sample not breaking. The 1045 sample did not have the properties as the 1018 sample although they are both plain carbons. The cold-finished sample started to become ductile at a higher temperature than the 1018. The 1045 sample has more carbon in the sample than the 1018. The more carbon in the sample causes the sample to become stronger and more brittle. The DBTT is moved to a higher position than the 1018 sample. However when comparing the normalized to the cold-finished sample, the opposite happens. When the material was normalized, the material was ductile at a lower temperature and then became brittle. The normalized material had a lower impact energy than the cold-finished sample. When comparing the 1095 sample to the other plain carbon samples, the impact energy became less than the plain carbon sample with the least amount of carbon. The sample became very brittle and easy to break. However when the samples are normalized, the more carbon present does not cause a change in whether or not the material is ductile or brittle. The more carbon in a material causes the material to remain brittle and normalizing the material does not change that property. In comparison to the aluminum alloy, the polyvinyl chloride, and stainless steel, the plain carbon cold finished sample with the least amount of carbon had the second highest impact energy. The stainless steel had the highest. Data found in Table 1. The stainless steel composition of the stainless steel shows that it has quite a bit of chromium and less than 0.12% carbon. Chromium is a very ductile metal which helps to explain why its impact energy was higher than the other materials. Conclusion The stainless steel had the highest impact energy as temperature increases. The stainless steel has Chromium which is a very ductile metal. The very ductile materials tended to have the higher impact energy. For the plain carbons, the lower amount of carbon caused the material to This study source was downloaded by 100000826450926 from CourseHero.com on 01-04-2022 11:58:45 GMT -06:00 https://www.coursehero.com/file/8842345/Charpy-Lab-Write-Up/ have higher impact energy. As more carbon is added to a material, the material becomes very brittle and has lower impact energy. Temperature affects each material different based on its composition of the material and whether or not the material is ductile or not. The temperature is used to determine the DBTT of the material. References Askeland, Donald R., Pradeep P. Fulay, and Wendelin Wright. The Science and Materials. 6th ed. Stamford: Cengage Learning, 2011. Print. Engineering of Kobayashi, T., S. Morita, and H. J. Kim. "Progress and Development in the Instrumented Charpy Impact Test." Materialwissenschaft Und Werkstofftechnik 32.6 (2001): 525-31. Print. This study source was downloaded by 100000826450926 from CourseHero.com on 01-04-2022 11:58:45 GMT -06:00 https://www.coursehero.com/file/8842345/Charpy-Lab-Write-Up/ Powered by TCPDF (www.tcpdf.org)


