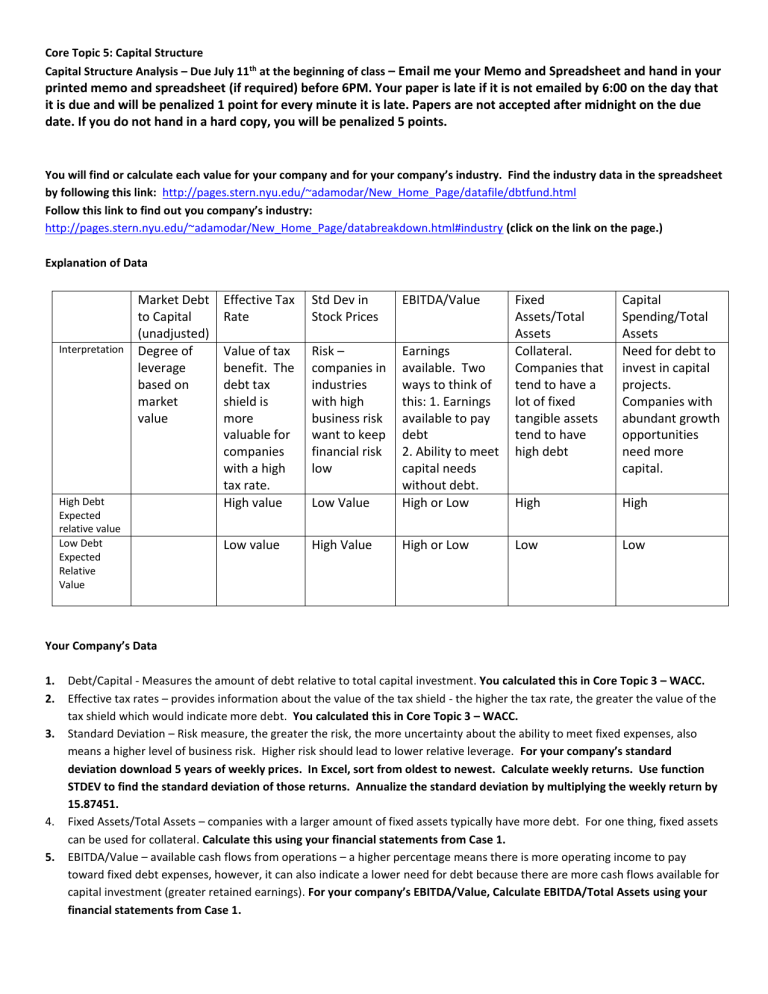
Core Topic 5: Capital Structure Capital Structure Analysis – Due July 11th at the beginning of class – Email me your Memo and Spreadsheet and hand in your printed memo and spreadsheet (if required) before 6PM. Your paper is late if it is not emailed by 6:00 on the day that it is due and will be penalized 1 point for every minute it is late. Papers are not accepted after midnight on the due date. If you do not hand in a hard copy, you will be penalized 5 points. You will find or calculate each value for your company and for your company’s industry. Find the industry data in the spreadsheet by following this link: http://pages.stern.nyu.edu/~adamodar/New_Home_Page/datafile/dbtfund.html Follow this link to find out you company’s industry: http://pages.stern.nyu.edu/~adamodar/New_Home_Page/databreakdown.html#industry (click on the link on the page.) Explanation of Data Market Debt to Capital (unadjusted) Interpretation Degree of leverage based on market value High Debt Expected relative value Low Debt Expected Relative Value Effective Tax Rate Std Dev in Stock Prices EBITDA/Value Value of tax benefit. The debt tax shield is more valuable for companies with a high tax rate. High value Risk – companies in industries with high business risk want to keep financial risk low Low Value Earnings available. Two ways to think of this: 1. Earnings available to pay debt 2. Ability to meet capital needs without debt. High or Low Low value High Value High or Low Fixed Assets/Total Assets Collateral. Companies that tend to have a lot of fixed tangible assets tend to have high debt Capital Spending/Total Assets Need for debt to invest in capital projects. Companies with abundant growth opportunities need more capital. High High Low Low Your Company’s Data 1. 2. 3. 4. 5. Debt/Capital - Measures the amount of debt relative to total capital investment. You calculated this in Core Topic 3 – WACC. Effective tax rates – provides information about the value of the tax shield - the higher the tax rate, the greater the value of the tax shield which would indicate more debt. You calculated this in Core Topic 3 – WACC. Standard Deviation – Risk measure, the greater the risk, the more uncertainty about the ability to meet fixed expenses, also means a higher level of business risk. Higher risk should lead to lower relative leverage. For your company’s standard deviation download 5 years of weekly prices. In Excel, sort from oldest to newest. Calculate weekly returns. Use function STDEV to find the standard deviation of those returns. Annualize the standard deviation by multiplying the weekly return by 15.87451. Fixed Assets/Total Assets – companies with a larger amount of fixed assets typically have more debt. For one thing, fixed assets can be used for collateral. Calculate this using your financial statements from Case 1. EBITDA/Value – available cash flows from operations – a higher percentage means there is more operating income to pay toward fixed debt expenses, however, it can also indicate a lower need for debt because there are more cash flows available for capital investment (greater retained earnings). For your company’s EBITDA/Value, Calculate EBITDA/Total Assets using your financial statements from Case 1. 6. Capital Spending/Total Assets – Indicates the capital need of the company. A company that tends to have more capital investment has a greater need for capital. A larger percentage can indicate a greater investment in growth. For your company’s Capital Spending/Total Assets, find your company’s Cash Flow Statement. Find “Capital Expenditures” for the most recent year. (You will see a negative number here. This is as expected because capital spending is an outflow. For your computations, ignore the negative sign.) Find Total Assets on the balance sheet. Market Debt to Capital (unadjusted) Effective Tax Rate Std Dev in Stock Prices EBITDA/Value Fixed Assets/Total Assets Capital Spending/Total Assets Industry: Your Company: “Memo” For each value, compare your company to the industry, total market, low-debt firms, high-debt firms. Discuss the ways in which your company’s capital structure is explained (or not) by each variable. Determine the dominant driving factor for company’s capital structure. Market Debt to Capital (Unadjusted) Effective tax rate Std dev in Stock Prices EBITDA/Value Fixed Assets/Total Assets Capital Spending/Total Assets Conclusion: What do you see as the primary driving factor or factors in your company’s capital structure decision? What is your assessment of your company’s capital structure? Do you recommend an increase or decrease in debt? Explain. Support your recommendation with details from your analysis. Note: Submit in Memo format. (Exclude all instructions, but you may keep the tables if you like.) I expect that all of your data and computations are in your case workbook (all of your case spreadsheets should be on separate worksheets in one Excel workbook.) You do not need to print a spreadsheet, but please email your spreadsheet with your memo so that I can reference your computations, if needed.


