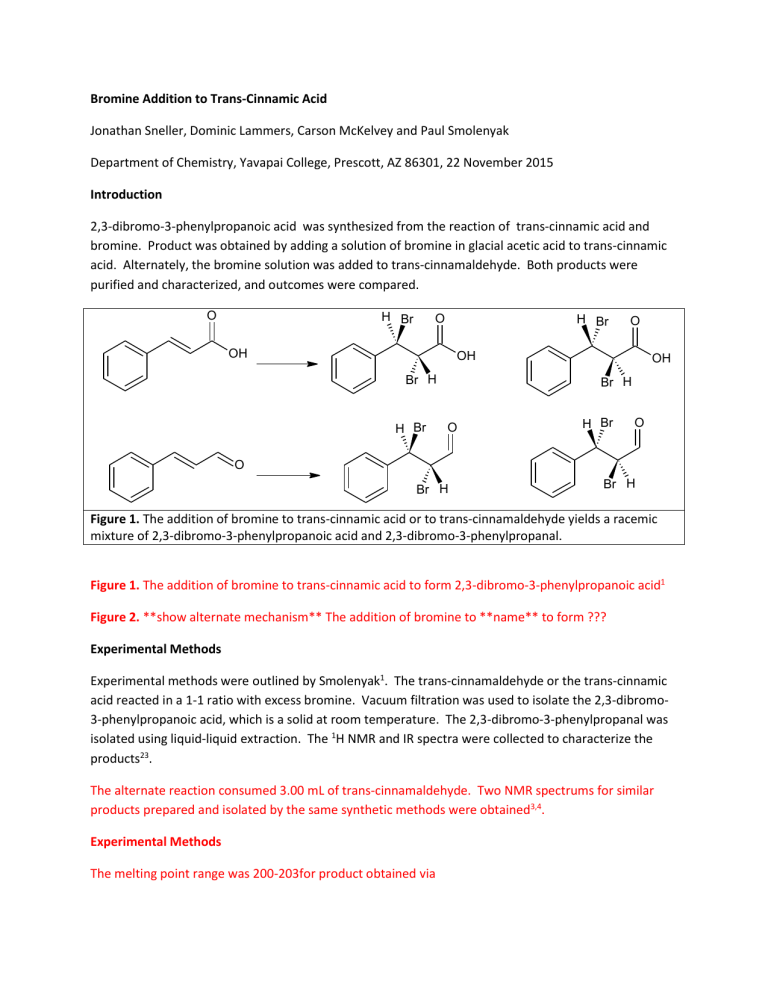
Bromine Addition to Trans-Cinnamic Acid Jonathan Sneller, Dominic Lammers, Carson McKelvey and Paul Smolenyak Department of Chemistry, Yavapai College, Prescott, AZ 86301, 22 November 2015 Introduction 2,3-dibromo-3-phenylpropanoic acid was synthesized from the reaction of trans-cinnamic acid and bromine. Product was obtained by adding a solution of bromine in glacial acetic acid to trans-cinnamic acid. Alternately, the bromine solution was added to trans-cinnamaldehyde. Both products were purified and characterized, and outcomes were compared. O H Br O H Br OH O OH Br H H Br OH Br H O H Br O O Br H Br H Figure 1. The addition of bromine to trans-cinnamic acid or to trans-cinnamaldehyde yields a racemic mixture of 2,3-dibromo-3-phenylpropanoic acid and 2,3-dibromo-3-phenylpropanal. Figure 1. The addition of bromine to trans-cinnamic acid to form 2,3-dibromo-3-phenylpropanoic acid1 Figure 2. **show alternate mechanism** The addition of bromine to **name** to form ??? Experimental Methods Experimental methods were outlined by Smolenyak1. The trans-cinnamaldehyde or the trans-cinnamic acid reacted in a 1-1 ratio with excess bromine. Vacuum filtration was used to isolate the 2,3-dibromo3-phenylpropanoic acid, which is a solid at room temperature. The 2,3-dibromo-3-phenylpropanal was isolated using liquid-liquid extraction. The 1H NMR and IR spectra were collected to characterize the products23. The alternate reaction consumed 3.00 mL of trans-cinnamaldehyde. Two NMR spectrums for similar products prepared and isolated by the same synthetic methods were obtained3,4. Experimental Methods The melting point range was 200-203for product obtained via Results The addition of bromine to trans-cinnamic acid gave an average of 63.5% percent. The addition of bromine to trans-cinnamaldehyde also resulted in formation of product, 3.7472g from 3.15g, but further analysis would be required to isolate and purify the product. Table 2 – The mass of the starting material (trans-cinnamic acid or transcinnamaldehyde). The experimental yield along with the calculated theoretical yield and percent yield. Mass of transcinnamic acid (g) Moles of trans- Theoretical Experimental Percent cinnamic acid yield (g) yield (g) yield (g) 2.9430 0.0199 2.9673 0.0200 Mass of transMoles of transcinnamaldehyde (g) cinnamaldehyde 3.15 0.0238 6.1174 6.1679 3.4841 4.2922 Experimental yield (g) 3.7472 57% 70% Figure 3. NMR spectrum of 2,3-dibromo-3-phenylpropanoic acid synthesized from trans-cinnamic acid4 Table 1. Weight of reactant, purified product, and theoretical product and percent yield The NMR spectrum of the 2,3-dibromo-3-phenylpropanoic acid produced spectrum indicative of a benzene ring, two hydrogens attached to carbons with bromine, and a hydrogen on a carboxylic acid. This is exactly the spectrum expected for 2,3-dibromo-3-phenylpropanoic acid. The IR spectrum also indicates bromine substitution from the strong IR absorbance in the 500-600 cm-1 range.4 The IR of the product of trans-cinnamaldehyde and bromine showed similar absorbance’s in 500-600 cm-1 range indicative of bromine-carbon bonds. CKM19D-3.SK Normalized Intensity 0.10 0.05 0 4.69 7.5 0.66 2.00 7.0 6.5 6.0 Chemical Shift (ppm) 5.5 5.0 Figure 4 – The 1H NMR for 2,3-dibromo-3-phenylpropanoic acid. 100 * Mon N o v 3 0 11 :59 :53 20 15 (G MT-0 7:0 0) 95 90 85 80 75 70 %T 65 60 55 50 45 40 35 30 25 20 400 0 350 0 300 0 250 0 200 0 150 0 100 0 500 W av enu mber s ( c m- 1) Figure 1 – The IR spectrum of 2,3-dibromo-3-phenylpropanoic acid in KBr. Discussion The product obtained had a higher weight than the reactants, indicating the successful addition of bromine to trans-cinnamic acid and trans-cinnamaldehyde. Analyses of the transmittance peaks in the product’s IR spectrum in figure 2 were found to be consistent with those in the known IR spectrum for 2,3-dibromo-3-phenylpropanoic acid displayed in Figure 3. The melting point of 200°C -203°C is consistent with the melting point of the (2R,3S) and the (2S,3R) enantiomers of 2,3-dibromo-3phenylpropanoic acid5. The narrow melting range indicates that the products were pure. The melting point range for the product formed from trans-cinnamaldehyde and bromine had a melting point range of 56°C to 61°C. This product is likely a mixture of 2,3-dibromo-3-pheylpropanoic acid and 2,3-dibromo3-phenylporpanal, which would account for the much lower melting point; aldehydes have weaker intermolecular forces due to the decreased hydrogen bonding. The peak form and integration of the NMR spectrum in figure. 4, for a product prepared by identical synthetic methods, was consistent with the values expected for 2,3-dibromo-3-phenylpropanoic acid. The data collected indicates the successful synthesis of (2R,3S) and (2S,3R) enantiomers of 2,3-dibromo-3-phenylpropanoic acid. 1. 2. "α,β-Dibromohydrocinnamic Acid." Nist.gov. National Institute of Standard and Technology, 2011. Web. 23 Nov. 2014. http://webbook.nist.gov/cgi/cbook.cgi?ID=C6286302&Mask=80 5. J. W. Lehman, Operational Organic Chemistry, 3rd Ed., pp. 175 – 181, Prentice Hall, Upper Saddle River, NJ, 1999 1 Smolenyak, P.E. Organic Chemistry Laboratory 1, 2015, Yavapai College, Prescott, Arizona 2 Anasazi Eft-60 NMR http://aiinmr.com 3 Thermo Scientific Nicolet 380 FTIR http://www.thermoscientific.com 4 "Infrared Spectroscopy Correlation Table." Wikipedia. Wikimedia Foundation, n.d. Web. 10 Dec. 2015. 100 * Mon N o v 3 0 13 :04 :43 20 15 (G MT-0 7:0 0) 95 90 85 %T 80 75 70 65 60 55 400 0 350 0 300 0 250 0 200 0 150 0 100 0 W av enu mber s ( c m- 1) IR from Dominic L. of solid product in KBr Notes: The things I highlighted in red I though should be removed and the things in blue I thought might need revision or deletion but I wanted your opinion. The figure captions are wrong but I though you may be adding data so I’ll let you sort them all out I put the IR of my product in case you wanted to use it. I didn’t think it was important. All of Carson’s data is in the tables. Let me know if you need anything else 500
