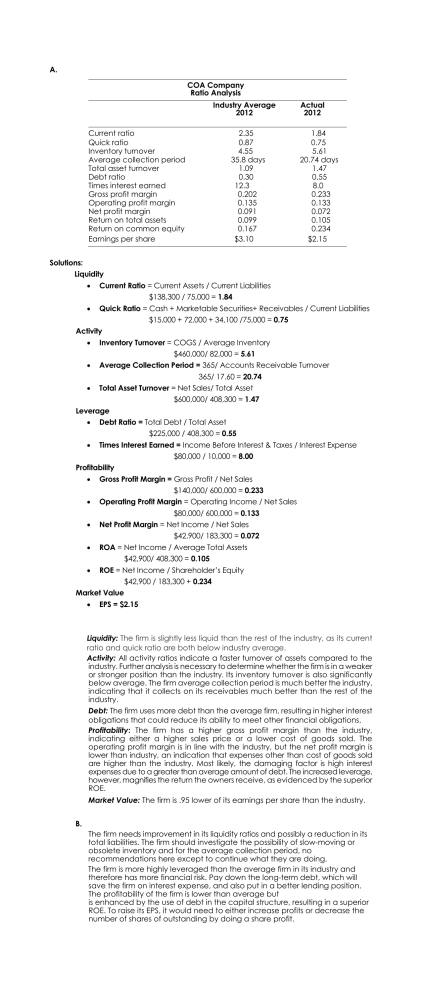
A. COA Company Ratio Analysis Industry Average 2012 Current ratio Quick ratio Inventory turnover Average collection period Total asset turnover Debt ratio Times interest earned Gross profit margin Operating profit margin Net profit margin Return on total assets Return on common equity Earnings per share 2.35 0.87 4.55 35.8 days 1.09 0.30 12.3 0.202 0.135 0.091 0.099 0.167 $3.10 Actual 2012 1.84 0.75 5.61 20.74 days 1.47 0.55 8.0 0.233 0.133 0.072 0.105 0.234 $2.15 Solutions: Liquidity Current Ratio = Current Assets / Current Liabilities $138,300 / 75,000 = 1.84 Quick Ratio = Cash + Marketable Securities+ Receivables / Current Liabilities $15,000 + 72,000 + 34,100 /75,000 = 0.75 Activity Inventory Turnover = COGS / Average Inventory $460,000/ 82,000 = 5.61 Average Collection Period = 365/ Accounts Receivable Turnover 365/ 17.60 = 20.74 Total Asset Turnover = Net Sales/ Total Asset $600,000/ 408,300 = 1.47 Leverage Debt Ratio = Total Debt / Total Asset $225,000 / 408,300 = 0.55 Times Interest Earned = Income Before Interest & Taxes / Interest Expense $80,000 / 10,000 = 8.00 Profitability Gross Profit Margin = Gross Profit / Net Sales $140,000/ 600,000 = 0.233 Operating Profit Margin = Operating Income / Net Sales $80,000/ 600,000 = 0.133 Net Profit Margin = Net Income / Net Sales $42,900/ 183,300 = 0.072 ROA = Net Income / Average Total Assets $42,900/ 408,300 = 0.105 ROE = Net Income / Shareholder’s Equity $42,900 / 183,300 + 0.234 Market Value EPS = $2.15 Liquidity: The firm is slightly less liquid than the rest of the industry, as its current ratio and quick ratio are both below industry average. Activity: All activity ratios indicate a faster turnover of assets compared to the industry. Further analysis is necessary to determine whether the firm is in a weaker or stronger position than the industry. Its inventory turnover is also significantly below average. The firm average collection period is much better the industry, indicating that it collects on its receivables much better than the rest of the industry. Debt: The firm uses more debt than the average firm, resulting in higher interest obligations that could reduce its ability to meet other financial obligations. Profitability: The firm has a higher gross profit margin than the industry, indicating either a higher sales price or a lower cost of goods sold. The operating profit margin is in line with the industry, but the net profit margin is lower than industry, an indication that expenses other than cost of goods sold are higher than the industry. Most likely, the damaging factor is high interest expenses due to a greater than average amount of debt. The increased leverage, however, magnifies the return the owners receive, as evidenced by the superior ROE. Market Value: The firm is .95 lower of its earnings per share than the industry. B. The firm needs improvement in its liquidity ratios and possibly a reduction in its total liabilities. The firm should investigate the possibility of slow-moving or obsolete inventory and for the average collection period, no recommendations here except to continue what they are doing. The firm is more highly leveraged than the average firm in its industry and therefore has more financial risk. Pay down the long-term debt, which will save the firm on interest expense, and also put in a better lending position. The profitability of the firm is lower than average but is enhanced by the use of debt in the capital structure, resulting in a superior ROE. To raise its EPS, it would need to either increase profits or decrease the number of shares of outstanding by doing a share profit.


