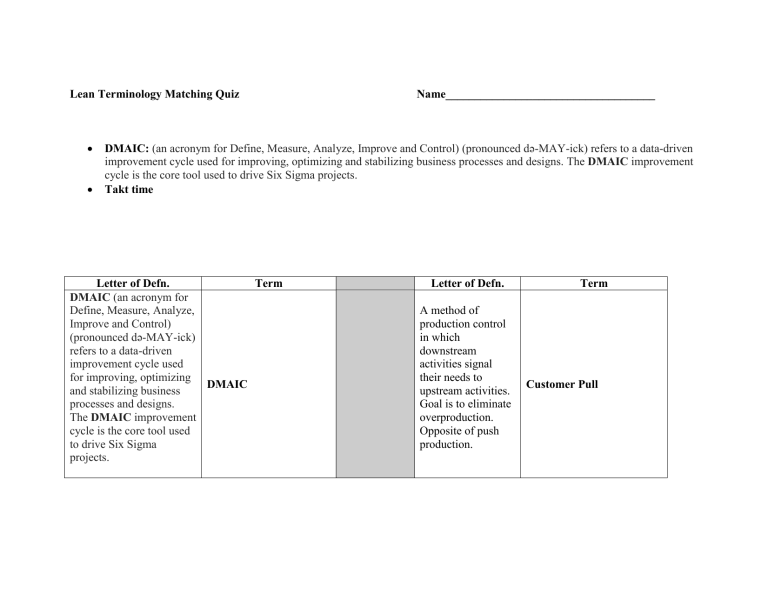
Lean Terminology Matching Quiz Name____________________________________ DMAIC: (an acronym for Define, Measure, Analyze, Improve and Control) (pronounced də-MAY-ick) refers to a data-driven improvement cycle used for improving, optimizing and stabilizing business processes and designs. The DMAIC improvement cycle is the core tool used to drive Six Sigma projects. Takt time Letter of Defn. Term DMAIC (an acronym for Define, Measure, Analyze, Improve and Control) (pronounced də-MAY-ick) refers to a data-driven improvement cycle used for improving, optimizing DMAIC and stabilizing business processes and designs. The DMAIC improvement cycle is the core tool used to drive Six Sigma projects. Letter of Defn. A method of production control in which downstream activities signal their needs to upstream activities. Goal is to eliminate overproduction. Opposite of push production. Term Customer Pull It is the average unit production time needed to meet customer demand and is calculated by dividing the time available (minutes of work/day) by the customer demand (units required/day) Takt time Japanese term that translates to "card" or "board" and indicates some form of signal within a process. A part of Just In Time (JIT) processing where either a physical or Kanban electronic device indicates that it's time to order inventory, process a unit or move to the next step in a process. A disciplined, data-driven approach and methodology for eliminating defects (driving toward six standard deviations Six Sigma between the mean and the nearest specification limit) in any process –from manufacturing to WIP A workplace organization technique composed composed of 5 primary phases: 5S Sort, Set In Order, Shine, Standardize, and Sustain. A translation of a Japanese term meaning “to mistake-proof.” Poke-Yoke transactional and from product to service. •A set of techniques and tools for process improvement. •A set of management techniques intended to improve business processes by greatly reducing the probability that an error or defect will occur. •A quality-control program developed in 1986 by Motorola that emphasizes cycle-time improvement and the reduction of manufacturing defects to a level of no more than 3.4 per million. Fishbone Diagram An individual who receives approximately two weeks of training in DMAIC, analytical problem-solving, and change management methods. A Green Belt is a part-time Green Belt Six Sigma position that applies Six Sigma to his/her local area, doing smaller-scoped projects and providing support to Black Belt projects. In practice a Kaizen is a Rapid Improvement Event that generally spans from 1 to 5 days and involves key process participants Kaizen focusing on solving a narrowly scoped process improvement opportunity. Root Cause Analysis means that parts are moved through operations from step to step with no work-inprocess (WIP) in between either one piece at a time or a small batch at a time. Waiting, Overproduction, Rework, Motion, Processing, Inventory, Intellect, Transportation 1-Piece Flow 7 Wastes Waste represents material, effort, and time that does not add value in the eyes of key stakeholders (customers, employees, investors). An alert system that can be visual or audible, facilitating quick response Andon to any problems in the process or system. Waiting, Overproduction, Rework, Motion, Processing, Inventory, Intellect, Transportation Defects, Overproduction, Waiting, Nonutilized Talent, Transportation, Inventory, Motion, Excess Processing Muda A procedure used to identify, assess, and mitigate risks associated with potential product, system, or process failure modes FMEA The bounds of acceptable performance for a characteristic. Specification Limits Acronym for a visual representation of a process or system (Supplier, Input, Process, Output, Customer). The most powerful tool of statistical process control. It consists of a run chart with statistically determined upper and lower control limits and a centerline Control Limits Suppliers – providing key knowledge, data, or resources Inputs – SIPOC materials, labor, etc. used in the process Process – 5-10 key steps that transform inputs to outputs Outputs – final products/services of the process Customers – person/group receiving the output. Maybe internal or external Those non-random causes of variation that can be detected by the use of control charts and good process documentation A method of mapping that includes data as well as process steps with the goal of identifying waste in the system. Special Cause Variation A simple diagram of Value Stream Mapping every step involved (VSM) in the material and information flows needed to bring a product from order to delivery.


