Econometrics Critical Values: ADF, Cointegration Tests
Econometrics II, Fall 2017
Department of Economics, University of Copenhagen
Morten Nyboe Tabor
Critical Values
#1.1
Augmented Dickey-Fuller Test
Distribution 1% 2 .
Quantiles
5% 5% 10%
N (0
DF
DF c
DF l
, 1) − 2 .
33 − 1 .
96 − 1 .
64 − 1 .
28
− 2 .
56 − 2 .
23 − 1 .
94 − 1 .
62
−
−
3
3
.
.
43
96
−
−
3
3
.
.
12
66
−
−
2
3
.
.
86
41
−
−
2
3
.
.
57
13
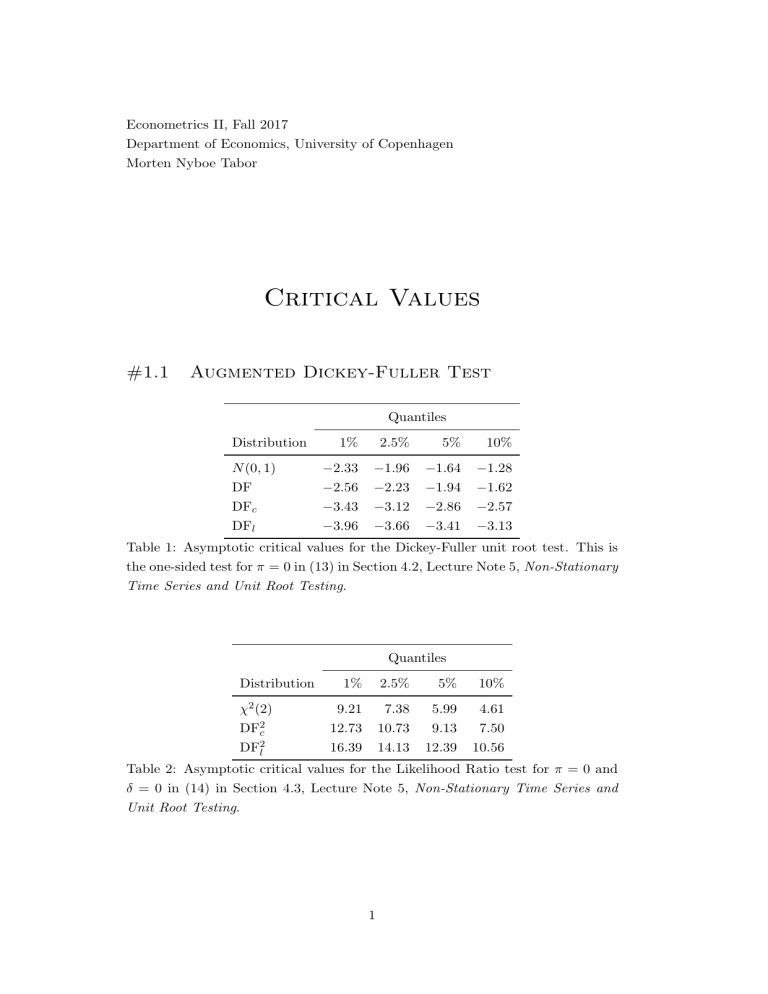
Table 1: Asymptotic critical values for the Dickey-Fuller unit root test. This is the one-sided test for π = 0 in (13) in Section 4.2, Lecture Note 5, Non-Stationary
Time Series and Unit Root Testing .
Quantiles
Distribution 1% 2 .
5% 5% 10%
χ
2
(2)
DF
2 c
DF
2 l
9
12
16 .
.
.
21
73
39
7
10
14 .
.
.
38
73
13
5
9
12 .
.
.
99
13
39
4
7
10 .
.
.
61
50
56
Table 2: Asymptotic critical values for the Likelihood Ratio test for π = 0 and
δ = 0 in (14) in Section 4.3, Lecture Note 5, Non-Stationary Time Series and
Unit Root Testing .
1
#1.2
Tests for No Cointegration
(A) Residual-based (ADF) test for no-cointegration
Number of estimated parameters
Constant in (22)
1% 5% 10%
Constant and trend in (22)
1% 5% 10%
0
1
2
3
4
− 3 .
43 − 2 .
86 − 2 .
57
− 3 .
90 − 3 .
34 − 3 .
04
− 4 .
29 − 3 .
74 − 3 .
45
− 4 .
64 − 4 .
10 − 3 .
81
− 4 .
96 − 4 .
42 − 4 .
13
− 3 .
96 − 3 .
41
− 4 .
32 − 3 .
78
− 4 .
66 − 4 .
12
− 4 .
97 − 4 .
43
− 5 .
25 − 4 .
72
− 3 .
13
− 3 .
50
− 3 .
84
− 4 .
15
− 4 .
43
Number of estimated parameters
(B) PcGive test for no-cointegration
Constant in (22)
1% 5% 10%
Constant and trend in (22)
1% 5% 10%
4
5
2
3
− 3 .
79 − 3 .
21 − 2 .
91
− 4 .
09 − 3 .
51 − 3 .
19
− 4 .
36 − 3 .
76 − 3 .
44
− 4 .
59 − 3 .
99 − 3 .
66
− 4 .
25 − 3 .
69
− 4 .
50 − 3 .
93
− 4 .
72 − 4 .
14
− 4 .
93 − 4 .
34
− 3 .
39
− 3 .
62
− 3 .
83
− 4 .
03
Table 3: Asymptotic critical values for tests of no-cointegration in Section 3 in
Lecture Note 6, Cointegration and Common Trends . Reproduced from Davidson and MacKinnon (1993).
2
