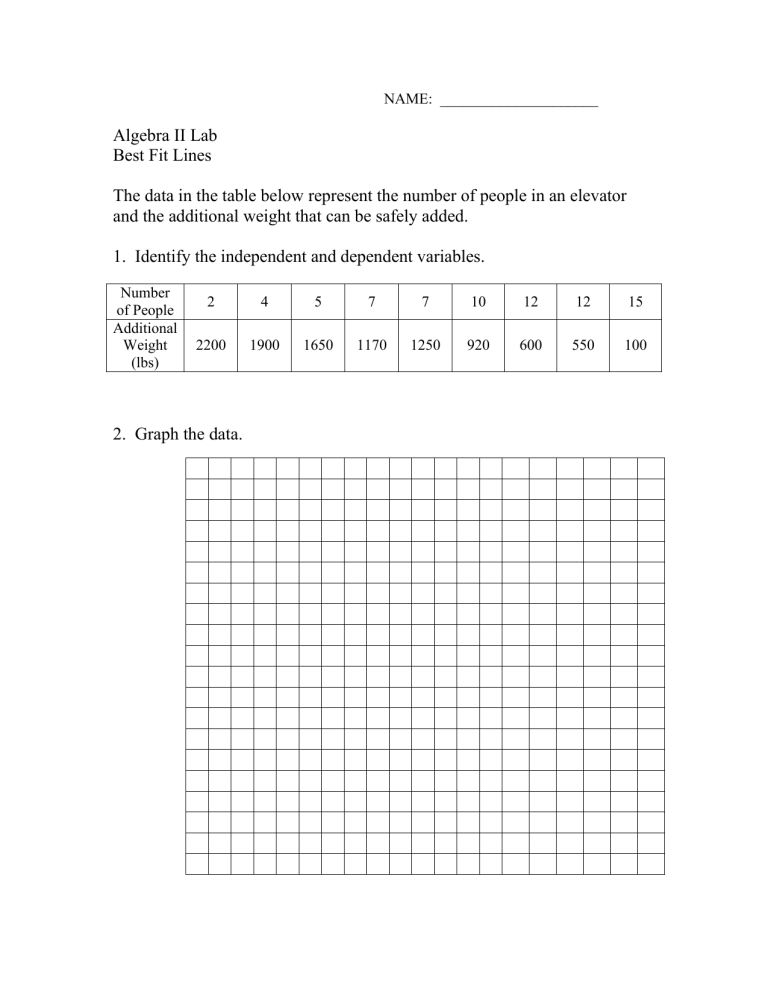
NAME: _____________________ Algebra II Lab Best Fit Lines The data in the table below represent the number of people in an elevator and the additional weight that can be safely added. 1. Identify the independent and dependent variables. Number of People Additional Weight (lbs) 2 4 5 7 7 10 12 12 15 2200 1900 1650 1170 1250 920 600 550 100 2. Graph the data. 3. Describe the correlation of the data. 4. Draw the line of best fit, through 2 of the given data points. 5. Estimate the correlation coefficient r. 6. Which points did you draw your line through? ( ________, ________ ) and ( ________, ________) 7. Calculate the slope of your line. Round to the closest tenth. 8. Calculate the y-intercept of your line. 9. Write the equation of your line in slope-intercept form. 10. If there are 11 people on the elevator how many 150 pound refrigerators would be safe to add on?

