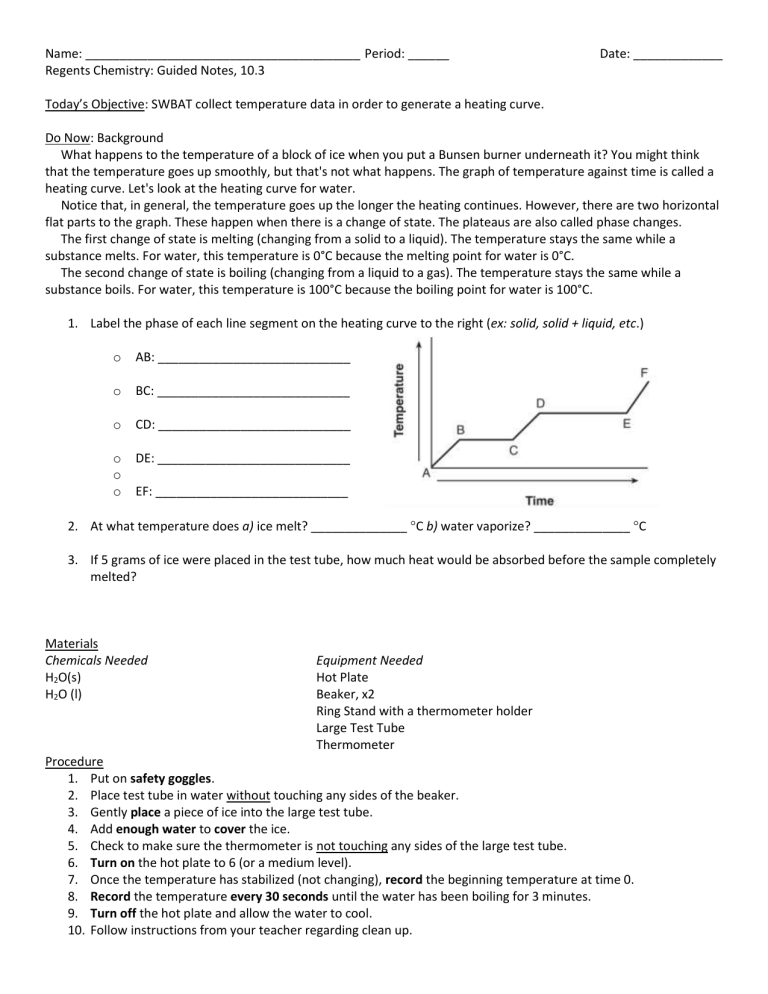
Name: ________________________________________ Period: ______ Regents Chemistry: Guided Notes, 10.3 Date: _____________ Today’s Objective: SWBAT collect temperature data in order to generate a heating curve. Do Now: Background What happens to the temperature of a block of ice when you put a Bunsen burner underneath it? You might think that the temperature goes up smoothly, but that's not what happens. The graph of temperature against time is called a heating curve. Let's look at the heating curve for water. Notice that, in general, the temperature goes up the longer the heating continues. However, there are two horizontal flat parts to the graph. These happen when there is a change of state. The plateaus are also called phase changes. The first change of state is melting (changing from a solid to a liquid). The temperature stays the same while a substance melts. For water, this temperature is 0°C because the melting point for water is 0°C. The second change of state is boiling (changing from a liquid to a gas). The temperature stays the same while a substance boils. For water, this temperature is 100°C because the boiling point for water is 100°C. 1. Label the phase of each line segment on the heating curve to the right (ex: solid, solid + liquid, etc.) o AB: ____________________________ o BC: ____________________________ o CD: ____________________________ o o o DE: ____________________________ EF: ____________________________ 2. At what temperature does a) ice melt? ______________ C b) water vaporize? ______________ C 3. If 5 grams of ice were placed in the test tube, how much heat would be absorbed before the sample completely melted? Materials Chemicals Needed H2O(s) H2O (l) Equipment Needed Hot Plate Beaker, x2 Ring Stand with a thermometer holder Large Test Tube Thermometer Procedure 1. Put on safety goggles. 2. Place test tube in water without touching any sides of the beaker. 3. Gently place a piece of ice into the large test tube. 4. Add enough water to cover the ice. 5. Check to make sure the thermometer is not touching any sides of the large test tube. 6. Turn on the hot plate to 6 (or a medium level). 7. Once the temperature has stabilized (not changing), record the beginning temperature at time 0. 8. Record the temperature every 30 seconds until the water has been boiling for 3 minutes. 9. Turn off the hot plate and allow the water to cool. 10. Follow instructions from your teacher regarding clean up. Data and Observations Time (seconds) Temperature (C) Physical Phase (circle one) Time (seconds) Temperature (C) Physical Phase (circle one) 0 S/L/G S/L/G 30 S/L/G S/L/G 60 (= 1 min) S/L/G S/L/G 90 S/L/G S/L/G 120 (= 2 min) S/L/G S/L/G 150 S/L/G S/L/G 180 (= 3 min) S/L/G S/L/G S/L/G S/L/G S/L/G S/L/G S/L/G S/L/G S/L/G S/L/G S/L/G S/L/G S/L/G S/L/G S/L/G S/L/G S/L/G S/L/G S/L/G S/L/G S/L/G S/L/G S/L/G S/L/G Analysis 1. What is the data range for the temperature on the heating curve? ________________ C 2. What is the data range for the time on the heating curve? __________________ seconds 3. Compare the heat of fusion to the heat of vaporization. Hint: Which phase change required more heat?
