IB1 Physics Heating Curve of Water Lab
advertisement
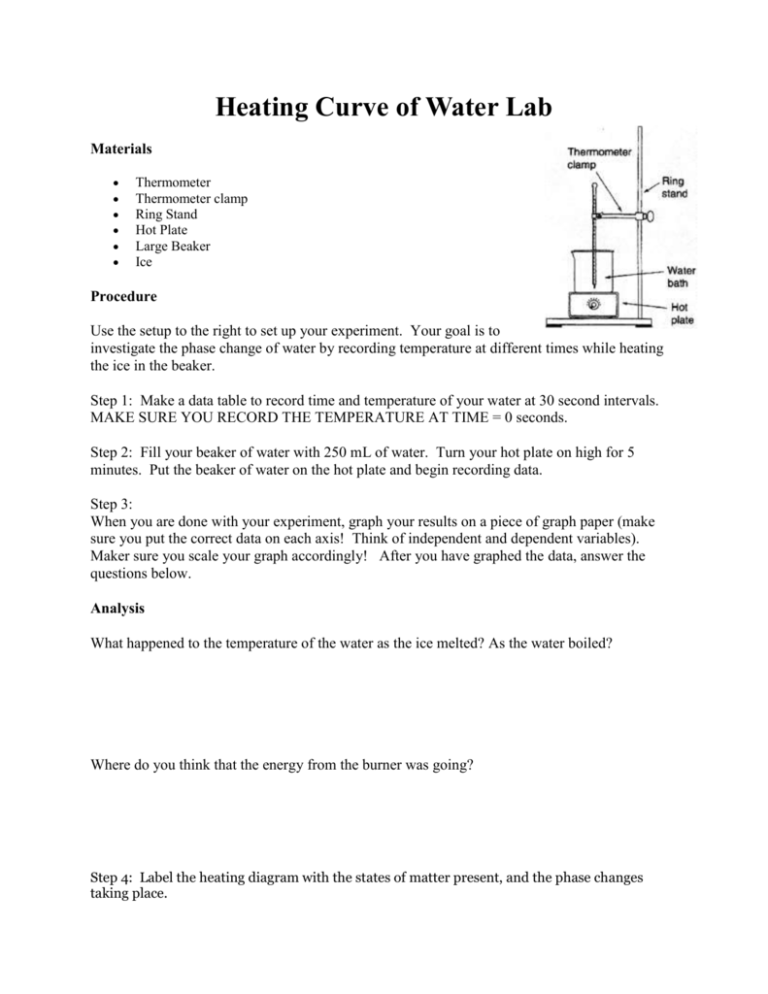
Heating Curve of Water Lab Materials Thermometer Thermometer clamp Ring Stand Hot Plate Large Beaker Ice Procedure Use the setup to the right to set up your experiment. Your goal is to investigate the phase change of water by recording temperature at different times while heating the ice in the beaker. Step 1: Make a data table to record time and temperature of your water at 30 second intervals. MAKE SURE YOU RECORD THE TEMPERATURE AT TIME = 0 seconds. Step 2: Fill your beaker of water with 250 mL of water. Turn your hot plate on high for 5 minutes. Put the beaker of water on the hot plate and begin recording data. Step 3: When you are done with your experiment, graph your results on a piece of graph paper (make sure you put the correct data on each axis! Think of independent and dependent variables). Maker sure you scale your graph accordingly! After you have graphed the data, answer the questions below. Analysis What happened to the temperature of the water as the ice melted? As the water boiled? Where do you think that the energy from the burner was going? Step 4: Label the heating diagram with the states of matter present, and the phase changes taking place. Post-Lab Questions: Analyze the Phase Diagram of an Unknown Substance D C B A What is the melting point of the substance? What is the boiling point of the substance? What letter on the diagram indicates solid is present only? What letter on the diagram indicates a gas is present only? What letter on the diagram indicates a liquid is present only? What letter on the diagram indicates both solid AND liquid are present?
