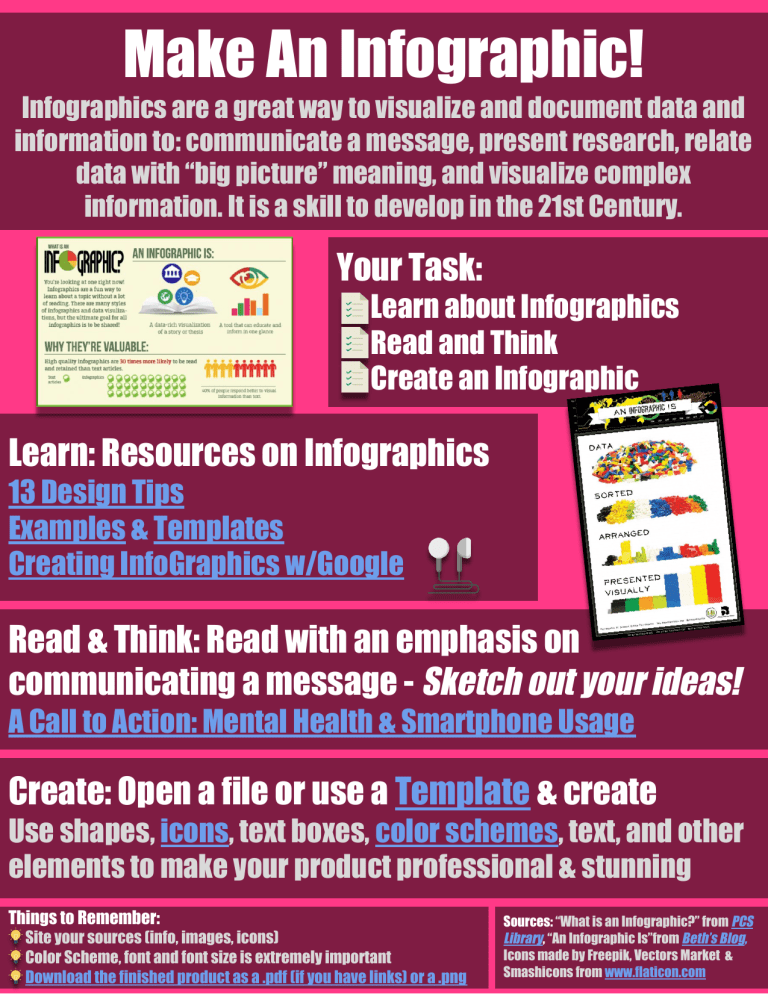
Make An Infographic! Infographics are a great way to visualize and document data and information to: communicate a message, present research, relate data with “big picture” meaning, and visualize complex information. It is a skill to develop in the 21st Century. Your Task: Learn about Infographics Read and Think Create an Infographic Learn: Resources on Infographics 13 Design Tips Examples & Templates Creating InfoGraphics w/Google Read & Think: Read with an emphasis on communicating a message - Sketch out your ideas! A Call to Action: Mental Health & Smartphone Usage Create: Open a file or use a Template & create Use shapes, icons, text boxes, color schemes, text, and other elements to make your product professional & stunning Things to Remember: Site your sources (info, images, icons) Color Scheme, font and font size is extremely important Download the finished product as a .pdf (if you have links) or a .png Sources: “What is an Infographic?” from PCS Library, “An Infographic Is”from Beth’s Blog, Icons made by Freepik, Vectors Market & Smashicons from www.flaticon.com
