Lab Report Format
advertisement

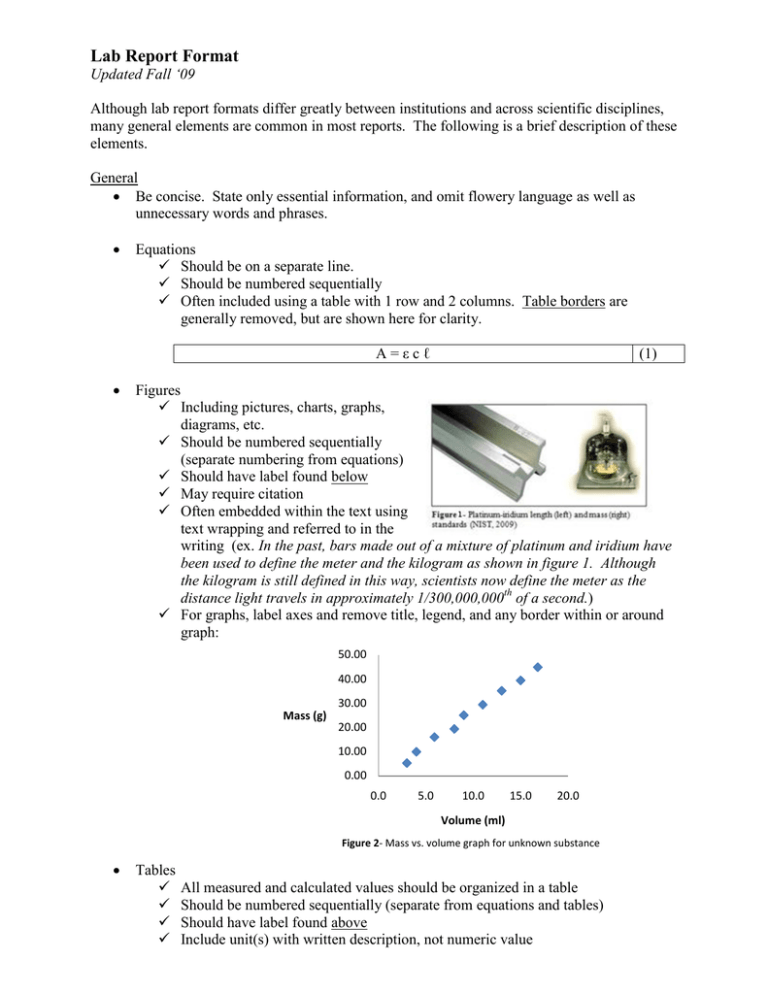
Lab Report Format Updated Fall ‘09 Although lab report formats differ greatly between institutions and across scientific disciplines, many general elements are common in most reports. The following is a brief description of these elements. General Be concise. State only essential information, and omit flowery language as well as unnecessary words and phrases. Equations Should be on a separate line. Should be numbered sequentially Often included using a table with 1 row and 2 columns. Table borders are generally removed, but are shown here for clarity. A=εcℓ (1) Figures Including pictures, charts, graphs, diagrams, etc. Should be numbered sequentially (separate numbering from equations) Should have label found below May require citation Often embedded within the text using text wrapping and referred to in the writing (ex. In the past, bars made out of a mixture of platinum and iridium have been used to define the meter and the kilogram as shown in figure 1. Although the kilogram is still defined in this way, scientists now define the meter as the distance light travels in approximately 1/300,000,000th of a second.) For graphs, label axes and remove title, legend, and any border within or around graph: 50.00 40.00 30.00 Mass (g) 20.00 10.00 0.00 0.0 5.0 10.0 15.0 20.0 Volume (ml) Figure 2- Mass vs. volume graph for unknown substance Tables All measured and calculated values should be organized in a table Should be numbered sequentially (separate from equations and tables) Should have label found above Include unit(s) with written description, not numeric value Keep related values in the same table when possible using multiple tables to separate and group data when appropriate Table 1- Solute mass measurements and calculations Mass of empty beaker (g) 120.00 Mass of beaker and dry solute (g) 156.23 Mass of dry solute (g) 36.23 % yield solute (%) 80.35 Sample Calculations Include 1 for each type of calculation Show in words first, then use numbers as shown to the right Mass of beaker and dry solute (g) – Mass of empty beaker (g) 156.23 g – 120.00 g = 36.23 g Percent Error Percent that a measured value differs from the accepted value % error = Mass of dry solute (g) experimental value – accepted value accepted value × 100 Percent Yield Used after the synthesis of chemicals to determine what percentage of the theoretical mass of product was actually formed; measure of the efficiency of a reaction % yield = = actual yield theoretical yield × 100 Introduction / Purpose Present relevant background information, chemical formulas, and/or equations Reveal hypothesis and/or goal for completing the experiment Procedure / Materials Provide another scientist with basic information needed to repeat what you did Avoid recapping each and every step that you did in lab, and omit anything that an experienced scientist should know Present information using one of the following methods: 1. List (numbers or bullets) 2. Narrative summary (paragraph with short sentences) Data / Analysis Present all measured and calculated values using properly labeled tables Include sample calculations if applicable Present properly labeled figures (i.e. images, graphs, charts, diagrams, etc. Calculate % error or % yield Discussion / Conclusion Revisit original hypothesis and/or goals of the experiment Indicate how successful you were using data (both measured and calculated) and stating the % error or % yield Comment on potential sources of error and future improvements in experimental design Suggest ideas for additional experimentation in the future


