Pressure Events of the Cardiac Cycle in
the Dog
Normal Right and Left Heart
By
HOWARD L. MOSCOVTTZ, M.D.
AND ROBERT J. WILDER,
M.D.
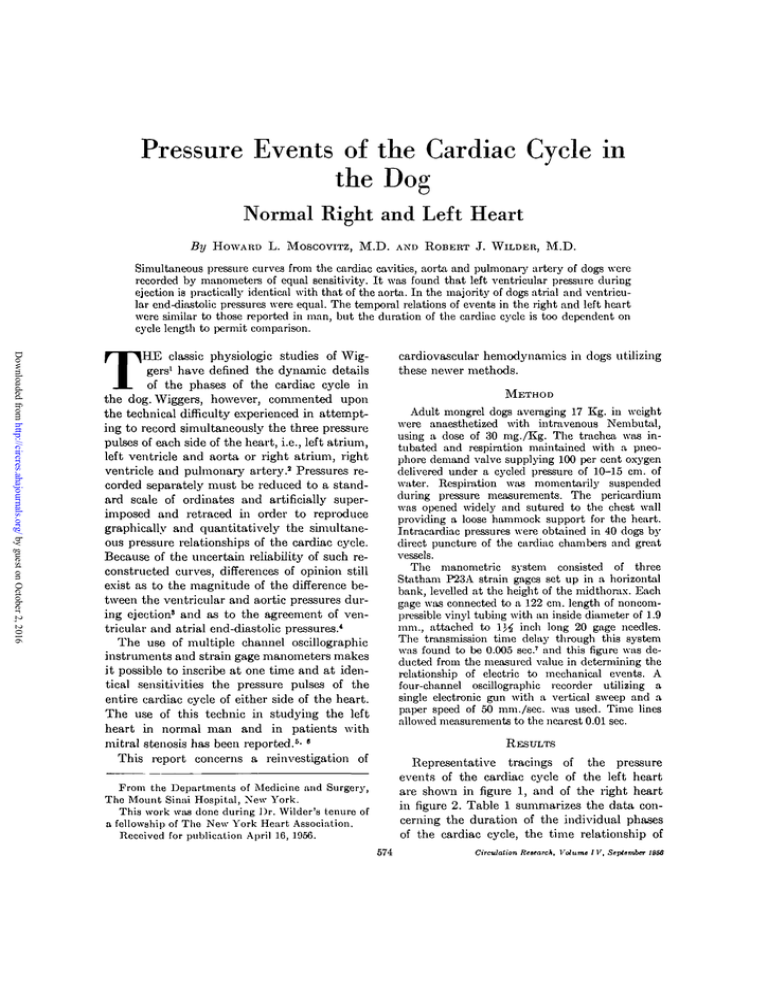
Simultaneous pressure curves from the cardiac cavities, aorta and pulmonary artery of dogs were
recorded by manometers of equal sensitivity. It was found that left ventricular pressure during
ejection is practically identical with that of the aorta. In the majority of dogs atrial and ventricular end-diastolic pressures were equal. The temporal relations of events in the right and left heart
were similar to those reported in man, but the duration of the cardiac cycle is too dependent on
cycle length to permit comparison.
Downloaded from http://circres.ahajournals.org/ by guest on October 2, 2016
T
cardiovascular hemodynamics in dogs utilizing
these newer methods.
HE classic physiologic studies of Wiggers1 have defined the dynamic details
of the phases of the cardiac cycle in
the dog. Wiggers, however, commented upon
the technical difficulty experienced in attempting to record simultaneously the three pressure
pulses of each side of the heart, i.e., left atrium,
left ventricle and aorta or right atrium, right
ventricle and pulmonary artery. 3 Pressures recorded separately must be reduced to a standard scale of ordinates and artificially superimposed and retraced in order to reproduce
graphically and quantitatively the simultaneous pressure relationships of the cardiac cycle.
Because of the uncertain reliability of such reconstructed curves, differences of opinion still
exist as to the magnitude of the difference between the ventricular and aortic pressures during ejection' and as to the agreement of ventricular and atrial end-diastolic pressures.4
The use of multiple channel oscillographic
instruments and strain gage manometers makes
it possible to inscribe at one time and at identical sensitivities the pressure pulses of the
entire cardiac cycle of either side of the heart.
The use of this technic in studying the left
heart in normal man and in patients with
mitral stenosis has been reported.Bi *
This report concerns a reiinvestigation of
METHOD
Adult mongrel dogs averaging 17 Kg. in weight
were anaesthetized with intravenous Nembutal,
using a dose of 30 mg./Kg. The trachea was intubated and respiration maintained with a pneophore demand valve supplying 100 per cent oxygen
delivered under a cycled pressure of 10-15 cm. of
water. Respiration was momentarily suspended
during pressure measurements. The pericardium
was opened widely and sutured to the chest wall
providing a loose hammock support for the heart.
Intracardiac pressures were obtained in 40 dogs by
direct puncture of the cardiac chambers and great
vessels.
The manometric system consisted of three
Statham P23A strain gages set up in a horizontal
bank, levelled at the height of the midthorax. Each
gage was connected to a 122 cm. length of noncompressible vinyl tubing with an inside diameter of 1.9
mm., attached to 1}£ inch long 20 gage needles.
The transmission time delay through this system
was found to be 0.005 sec.7 and this figure was deducted from the measured value in determining the
relationship of electric to mechanical events. A
four-channel oscillographic recorder utilizing a
single electronic gun with a vertical sweep and a
paper speed of 50 mm./sec. was used. Time lines
allowed measurements to the nearest 0.01 sec.
RESULTS
Representative tracings of the pressure
events of the cardiac cycle of the left heart
are shown in figure 1, and of the light heart
in figure 2. Table 1 summarizes the data concerning the duration of the individual phases
of the cardiac cycle, the time relationship of
From the Departments of Medicine and Surgery,
Tho Mount Sinai Hospital, New York.
This work was done during J)r. VVilder's tenure of
a fellowship of The New York Heart Association.
Received for publication April 16, 1956.
574
Circulation Research, Volume I V, S«p*«m!wr 1866
575
MOSCOVITZ AND WILDER
Downloaded from http://circres.ahajournals.org/ by guest on October 2, 2016
electric to mechanical events, and the pressure
levels on both sides of the heart.
The description of the phases of the cardiac
cycle, designated by the alphabetic symbols in
figures 1 and 2, largely follows that of Wiggers.1
Atrial contraction begins at A, producing the
a wave of the atrial pulse. In the illustrated
curves, the end-diastolic pressures in the
atrium and ventricle appear to be practically
equal, but in some records a brief reversal of
the atrioventricular pressure gradient can be
detected following the a wave. Ventricular
systole begins at B as the pressure starts to
rise, slowly at first then more rapidly. The c
wave of the atrial pulse begins its ascent at
the onset of ventricular contraction. Isometric
contraction commences at the point of the
crossover of the atrial and ventricular curves,
and this point marks the closure of the atrioventricular valve. Isometric contraction terminates at C as the semilunar valve opens and
rapid ejection into the aorta or pulmonary
artery begins. The pressure of the ventricle
barely exceeds that of the efferent artery as
they rise together in a parallel manner to reach
their common summit at D, the beginning of
reduced ejection. Reduced ejection continues
as the pressures decline together to E, the
onset of the incisura of the aortic or pulmonary artery curve. This point, the termination
of systole, may be difficult to locate precisely
on the pressure tracing. The phase of protodiastole (E-F) ends at the deepest point of
the incisural notch as the semilunar valve
closes, and the curves of the ventricle and
great vessel then diverge. Isometric relaxation begins at F and continues until the atrioventricular valve opens at G as the ventricular
and atrial curves again cross. Rapid diastolic
inflow into the ventricle begins at G and the
atrial and ventricular curves decline together
to the point H, with a barely detectable pressure gradient between them. This falling pressure curve during rapid ventricular filling
marks the descending limb of the atrial v
wave. With the slow heart rates, a phase of
diastasis (H-A) is present as the pressure in
the filling ventricle and communicating atrium
gradually begin to rise. Diastasis terminates
at .4 when atrial systole initiates a new cycle.
AORTA
LEFT
VENTRICLE
50-
25-
0-
Fio. 1. Simultaneous pressure pulses from tho left
atrium, left ventricle and aorta of a normal dog. Eloctrocardiogram is lead 2. Heart rato 130/min. (A-B)
atrial systole; (B-C) isometric contraction; (C-D)
rapid ejection; (D-E) reduced ejection; (E-F) protodiastole; (F-G) isometric relaxation; (G-H) rapid
diastolic inflow. No phase of diastaais is present.
DISCUSSION
Pressure pulses from atrium, ventricle and
efferent artery inscribed in superimposed fashion at equal sensitivities provide complete
graphic representations of the pressure events
of either side of the heart. The points of crossover of atrial and ventricular curves and the
onset of ejection from the ventricle into its
great vessel can be precisely designated on such
composite curves. Records such as these support the view that ventricular pressure exceeds
aortic by a barely measurable amount during
ejection. The exact relationship of atrial and
ventricular end-diastolic pressures has been
the cause of speculation. Little4 has postulated
that a brief reversal of the normal atrioven-
PRESSURE EVENTS IN THE RIGHT AND T/TCFT
PULMONARY
ARTERY
RIGHT
VENTRICLE
Downloaded from http://circres.ahajournals.org/ by guest on October 2, 2016
RIGHT
ATRIUM
Fie. 2. Simultaneous pressure pulses from right atrium, right ventricle and pulmonary artery of
a normal dog. (Ordinate, mm. Hg.) Lead 2. Heart rate S6/min. Phases of cardiac cycle are lettered
in same manner as figure 1. A phase of dinstasis (H-A) is present. Time lines 0.04 sec. apart.
tricular pressure gradient follows atrial contraction and is responsible for presystolic
closure of the A—V valves. In the present
study, pressure pulses of the right side of the
heart were recorded at a sufficiently high sensitivity to test this hypothesis. While not a
constant finding, 13 of 28 dogs demonstrated
such a phenomenon, indicating that at the
atrial z point, right ventricular pressure may
transiently exceed right atrial. This pressure
differential may in some cases float the A-V
valves into apposition before ventricular systole begins.
The data concerning the duration of the individual phases of the cardiac cycle of the left
heart of dogs (table 1) are at variance with
those of Wiggers1 by at most 0.01 sec, in those
instances where average values are available
for comparison. Accurate correlation with the
reported data on the human heart5'8> 9 is difficult because of considerable differences in cycle
length in the various studies. However, an
examination of the sequence of dynamic events
of the two sides of the dog heart yields data
essentially similar to the findings of Braunwald and associates3 in man. Atrial contraction begins sooner on the right, but left ventricular S3fstole precedes that of the right
ventricle. Because isometric contraction of the
left ventricle is considerably longer than that
of the right, ejection into the pulmonary artery
precedes ejection into the aorta.
Comparison of other characteristics of the
cardiac cycle of the right and left heart can
be made from the data. The left ventricle requires 0.06 sec. to elevate its pressure 80 mm.
Hg in an isometric fashion in order to eject
blood into the aorta. Right ventricular ejection occurs after an increment in pressure of
only one-eighth to one-tenth this amount, but
one third of this time is required (0.02 sec).
This is in part due to the fact that the initial
phase of isometric contraction occurs at a
slower rate than the final portion, and propor-
577
MOSCOVITZ AND WILDER
TABLE 1.—Summary of Duration of Phases of
Cardiac Cyr.le, Relation of Electric to Mechanical
Events and Average Pressure Levels.
Average heart rate/rain
Downloaded from http://circres.ahajournals.org/ by guest on October 2, 2016
Atriul systole (A-B)
Isometric contraction (B-C).
Rapid ejection (C-D)
Reduced ejection (D-E) .. .
Protodiastole (E-F)
Isomotric relaxation (F-G)..
Rapid diastolic inflow (G-H).
Diustosis (H-A)
Onset P to a wave
Onsot Q to ventricular systole
Onset Q to ventricular ejection
Atrial pressure (mean)
Ventricular prcssuro
Aortic or pulmonary artery
pressure
Pulse pressure average:
%: . . . .
Left heart
(34 dogs)
Right heart
(28 dogs)
130
125
sec.
sec.
0.076
0.059
0.107
0.052
0.017
0.064
0.073
0.030
0.05S
0.093
0.025
0.097
0.085
0.020
0.032
0.084
0.035
0.045
0.037
0.044
0.095
0.064
(mm. Fig)
(mm. Hg)
6
108/5
3
21/2
108/83
25
23%
12
ance and distensibility of the pulmonary and
systemic arterial circuits.
SUMMARY
Simultaneous pressure curves of equal sensitivity were obtained from the left atrium, left
ventricle and aorta of 34 normal dogs and from
the right atrium, right ventricle and pulmonaiy artery of 28 normal dogs.
It was found that left ventricular pressure
during ejection is practically identical with
that at the root of the aorta. In the majority
of the dogs, atrial and ventricular end-diastolic
pressure were equal, but in 13 of 28 dogs a
transient reversal of the normal pressure gradient appeared just prior to ventricular systole.
The temporal sequence of events on the two
sides of the human and dog heart is similar,
but the duration of the phases of the cardiac
cycle is too dependent upon cycle length for
adequate comparison.
21/10
57%
tionately this slow phase occupies more of the
total isometric contraction period of the right
ventricle than the left. The rate of pressure
ascent in the left ventricle during isometric
contraction is approximately 1300 mm./sec.
while in the right ventricle it is closer to 500
mm./sec.
The relative width of the pulse pressure of
the pulmonary artery is considerably greater
than that of the aorta. The aortic pulse pressure varies from 20-30 per cent of the left ventricular systolic height while the pulse pressure of the pulmonaiy artery is approximately
60 per cent of the peak right ventricular pressure. This explains in part the fact that ejection of blood into the pulmonary artery usually
precedes aortic ejection and persists for a
longer period.10 The shorter phases of isometric contraction and relaxation of the right
ventricle, as compared to the left, and the
relatively wider pulse pressure of the pulmonary artery than the aorta appear to be dependent upon differences in peripheral resist-
SUMMAIUO IN LVTERLINGUA
Simultanee curvas de pression de equal
sensibilitate esseva obtenite ab le atrio sinistre,
le ventriculo sinistre, e le aorta de 34 canes
normal e ab le atrio dextere, le ventriculo dextere, e le arteria pulmonar de 28 canes normal.
Esseva constatate que le nression sinistroventricular durante le ejection es practicamente identic con le pression al radice del
aorta. In le majoritate del canes, le pressiones
atrial e ventricular al fin del diastole esseva
equal, sed in 13 ex 28 canes un transiente reversion del normal gradiente de pression appareva immediatemente ante le systole ventricular.
Le succession temporal del evenimentos al
duo lateres del corde human e canin es simile.
Sed le duration del phases del cyclo cardiac es
nimis dependente del longor del cyclo pro
permitter un comparation adequate.
REFERENCES
C. J.: The Pressure Pulses in the
Cardiovascular System. London, Longmans,
Green
and Co., 192S.
5
—: Studies on the consecutive phases of the
cardiac cycle. I. The duration of the consecutive
phases of the cardiac cycle and the criteria for
1
WIGGEKS,
578
PRESSURE EVENTS IX THE RIGHT AND LEFT HEART
their precise determination. Am. J. Physiol'
56: 415, 1921.
5
BRAUNWALD, E., Moscovrrz, H. L., AMRAM, S.,
LASSER, H., SAPIN, S. 0., HXMSIELSTEIN, A.,
RAVITCH, M., AND GORDON, A.: The hemo-
Downloaded from http://circres.ahajournals.org/ by guest on October 2, 2016
dynamics of the left side of the heart as studied
by simultaneous left atrial, left ventricular and
aortic pressures: particular reference to mitral
stenosis. Circulation 12: 69, 1955.
•—, —, —, —, —, —, —, AND —: Timing of
electrical and mechanical events of the left side
of the human heart. J. Appl. Physiol. 8: 309,
1955.
GORDON,
A. J.,
BRAUNWALD,
E.,
MOSCOVITZ,
H. L., AND AiiRAM, S. S.: Delay in transmission
of a pressure impulse through a cardiac catheter
and vinyl plastic tubing. J. Appl. Physiol. 8:
573, 1956.
HAMILTON, W. F., AND BRACKETT, F. S.: Dynamic
considerations on the relation between aortic
and ventricular pressure curves. Am. J. Physiol.
112: 130, 1935.
* LITTLE, R. C : Effect of atrial systole on ventricular pressure and closure of the A-V valves. Am.
J. Physiol. 166: 2S9, 1951.
6
7
8
BRAUNWALD, E., FISHMAN, A. P., AND COTONAND,
A.: Time relationship of dynamic events in the
cardiac chambers, pulmonary artery and aorta
in man. Circulation Research 4: 100, 1956.
8
10
COBLENTZ, B., HARVEY, R. M., FERRER, M. I.,
COURNAND, A., AND RlCHARDS, D. W., J R . :
The relationship between electrical and mechanical events in the cardiac cycle of man.
Biit. Heart J. 11: 1, 1949.
KATZ, L. N.: The asynchronism of right and left
ventricular contraction and the independent
variations in their duration. Am. J. Physiol.
72: 655, 1925.
The Pulse Forni in Sclerotic Arteries
In patients with suspected sclerosis of the large arterial trunks, the characteristics
of the central pulse—large amplitude, pronounced incisura followed by rapid decline
of the curve—are transmitted to the radial ai-tery. (Wiggers, Ann. Int. Med. 6: 12,
1932). However, this valuable criterion of stiffening of the large arteries has not received
much clinical recognition.
The demonstration that femoral pulses taken from patients with sclerosis of the leg
vessels also show the same changes, is therefore of timely interest.
Animal experiments confirmed the conclusion that the characteristic femoral pulses
are not caused by the demonstrable sclerosis of leg vessels but by reduced distensibility
of the aorta.
For details sec H. Juiigmumi and W. D. Erdmann, Ztschcr. KrcigluufTorsch.
45: 252, 1956.
Pressure Events of the Cardiac Cycle in the Dog: Normal Right and Left Heart
HOWARD L. MOSCOVITZ and ROBERT J. WILDER
Downloaded from http://circres.ahajournals.org/ by guest on October 2, 2016
Circ Res. 1956;4:574-578
doi: 10.1161/01.RES.4.5.574
Circulation Research is published by the American Heart Association, 7272 Greenville Avenue, Dallas, TX 75231
Copyright © 1956 American Heart Association, Inc. All rights reserved.
Print ISSN: 0009-7330. Online ISSN: 1524-4571
The online version of this article, along with updated information and services, is located on the
World Wide Web at:
http://circres.ahajournals.org/content/4/5/574
Permissions: Requests for permissions to reproduce figures, tables, or portions of articles originally published in
Circulation Research can be obtained via RightsLink, a service of the Copyright Clearance Center, not the
Editorial Office. Once the online version of the published article for which permission is being requested is
located, click Request Permissions in the middle column of the Web page under Services. Further information
about this process is available in the Permissions and Rights Question and Answer document.
Reprints: Information about reprints can be found online at:
http://www.lww.com/reprints
Subscriptions: Information about subscribing to Circulation Research is online at:
http://circres.ahajournals.org//subscriptions/

