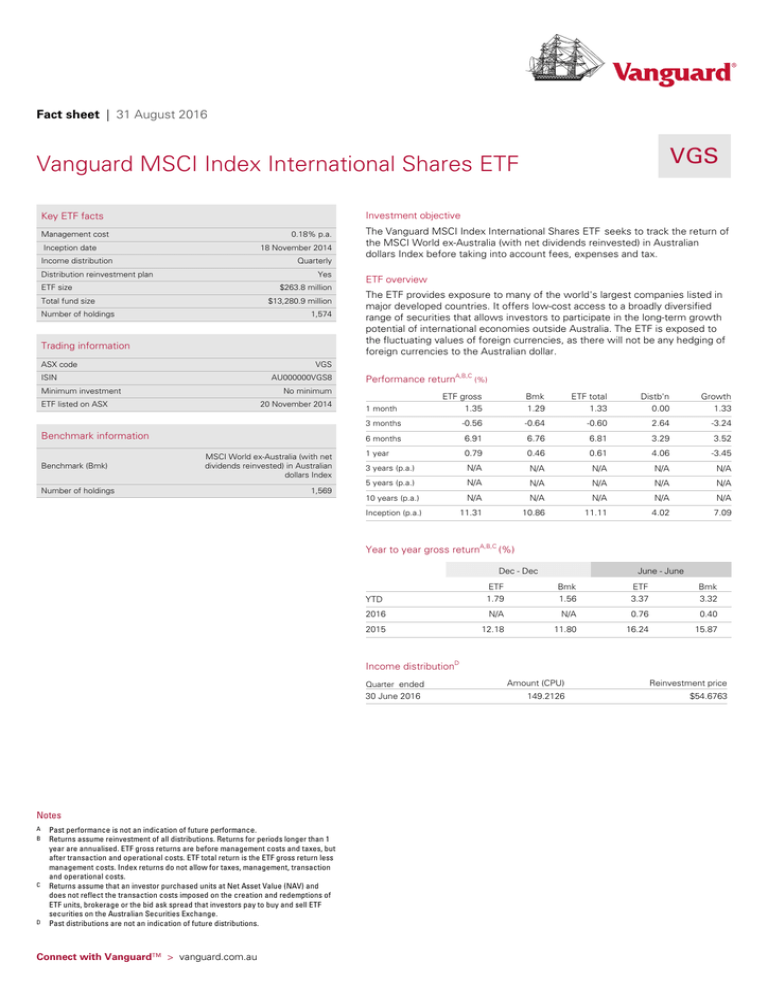
Fact sheet | 31 August 2016
VGS
Vanguard MSCI Index International Shares ETF
Investment objective
Key ETF facts
Management cost
0.18% p.a.
Inception date
18 November 2014
Income distribution
Quarterly
Distribution reinvestment plan
Yes
ETF size
$263.8 million
Total fund size
$13,280.9 million
Number of holdings
1,574
Trading information
ASX code
ETF overview
The ETF provides exposure to many of the world's largest companies listed in
major developed countries. It offers low-cost access to a broadly diversified
range of securities that allows investors to participate in the long-term growth
potential of international economies outside Australia. The ETF is exposed to
the fluctuating values of foreign currencies, as there will not be any hedging of
foreign currencies to the Australian dollar.
VGS
ISIN
AU000000VGS8
Minimum investment
Performance returnA,B,C (%)
No minimum
ETF listed on ASX
20 November 2014
Benchmark information
Benchmark (Bmk)
The Vanguard MSCI Index International Shares ETF seeks to track the return of
the MSCI World ex-Australia (with net dividends reinvested) in Australian
dollars Index before taking into account fees, expenses and tax.
MSCI World ex-Australia (with net
dividends reinvested) in Australian
dollars Index
Number of holdings
1,569
ETF gross
1.35
Bmk
1.29
ETF total
1.33
Distb'n
0.00
Growth
1.33
3 months
-0.56
-0.64
-0.60
2.64
-3.24
6 months
6.91
6.76
6.81
3.29
3.52
1 year
0.79
0.46
0.61
4.06
-3.45
3 years (p.a.)
N/A
N/A
N/A
N/A
N/A
5 years (p.a.)
N/A
N/A
N/A
N/A
N/A
10 years (p.a.)
N/A
N/A
N/A
N/A
N/A
Inception (p.a.)
11.31
10.86
11.11
4.02
7.09
1 month
Year to year gross returnA,B,C (%)
Dec - Dec
June - June
YTD
ETF
1.79
Bmk
1.56
ETF
3.37
Bmk
3.32
2016
N/A
N/A
0.76
0.40
2015
12.18
11.80
16.24
15.87
Income distributionD
Quarter ended
30 June 2016
Notes
A
B
C
D
Past performance is not an indication of future performance.
Returns assume reinvestment of all distributions. Returns for periods longer than 1
year are annualised. ETF gross returns are before management costs and taxes, but
after transaction and operational costs. ETF total return is the ETF gross return less
management costs. Index returns do not allow for taxes, management, transaction
and operational costs.
Returns assume that an investor purchased units at Net Asset Value (NAV) and
does not reflect the transaction costs imposed on the creation and redemptions of
ETF units, brokerage or the bid ask spread that investors pay to buy and sell ETF
securities on the Australian Securities Exchange.
Past distributions are not an indication of future distributions.
Connect with Vanguard™ > vanguard.com.au
Amount (CPU)
Reinvestment price
149.2126
$54.6763
Fact sheet | 31 August 2016
VGS
Vanguard MSCI Index International Shares ETF
Characteristics
Country allocation (%)
Number of holdings
ETF
1,574
Bmk
1,569
Median market cap
$64.9B
$64.8B
Price/Earnings ratio
22.3x
22.3x
2.2x
2.2x
Return on equity ratio
16.4%
16.2%
Earnings growth rate
7.0%
6.9%
Equity yield (dividend)
2.5%
2.5%
Price/Book ratio
Top 10 holdings
United States
Japan
United Kingdom
France
Canada
Germany
Switzerland
Hong Kong
Netherlands
Spain
ETF
61.1
9.0
7.3
3.7
3.6
3.4
3.4
1.3
1.3
1.2
Bmk
61.2
9.0
7.2
3.7
3.6
3.4
3.4
1.3
1.3
1.2
Sweden
Italy
Denmark
Belgium
Singapore
Finland
Israel
Norway
Ireland
Other
ETF
1.1
0.7
0.7
0.5
0.5
0.4
0.3
0.2
0.2
0.2
Bmk
1.1
0.7
0.7
0.5
0.5
0.4
0.3
0.2
0.2
0.2
1. Apple Inc.
2. Alphabet Inc.
Glossary
3. Microsoft Corp.
4. Exxon Mobil Corp.
5. Johnson & Johnson
6. Amazon.com Inc.
7. Facebook Inc.
8. General Electric Co.
9. Nestle SA
10. AT&T Inc.
The top 10 holdings represent 10.9% of the total ETF.
Sector allocation (%)
ETF
Bmk
Financials
18.9
18.8
Information Technology
15.2
15.2
Health Care
13.1
13.1
Consumer Discretionary
12.8
12.8
Industrials
11.1
11.2
Consumer Staples
10.8
10.8
Energy
6.7
6.6
Materials
4.6
4.6
Telecommunication Services
3.5
3.5
Utilities
3.3
3.4
Median market cap is the midpoint of market capitalisation
(market price multiplied by the number of shares outstanding) of
the shares in the fund. Half the shares in the fund will have
higher market capitalisation, half will have lower.
Price/Earnings ratio (P/E ratio) is a measure of the market
value of a share compared to the earnings of the company. A
share with a price of $10, and earnings last year of $1 a share,
would have a P/E ratio of 10. For a fund, the ratio is the
weighted average P/E ratio of the shares it holds. In general, a
high P/E suggests that investors are expecting higher earnings
growth in the future compared to companies with a lower P/E.
Price/Book ratio is calculated by dividing the current market
price of the share by the book value per share of the company.
Return on equity ratio is a measure of how much profit a
company generates relative to its shareholders’ equity. For a
fund, the ratio is the weighted average return on equity ratio of
the shares it holds.
Earnings growth rate is a measure of the trailing Earnings Per
Share growth for a given company and share. For a fund, the
rate is the weighted average earnings growth of the shares it
holds.
Equity yield (dividend) is the dividend income earned by
shares, expressed as a percentage of the market price of those
shares. For a fund, the yield is the weighted average equity yield
of the shares it holds.
For more information:
Personal investors can transact in Vanguard ETFs through their financial adviser or stockbroker.
Our telephone service is available from 8am to 6pm, Monday-Friday AEST.
For personal investors:
Call 1300 655 888
Email clientservices@vanguard.com.au
For advisers:
Call 1300 655 888
Email adviserservices@vanguard.com.au
For institutional investors:
Call 1300 655 888
Email institutional@vanguard.com.au
In preparing the above information, individual circumstances, for example tax implications, have not been taken into account and it may therefore not be applicable to an
individual's situation. Before making an investment decision, you should consider your or your clients' circumstances and whether the above information is applicable to your
or your clients' situation. Vanguard Investments Australia Ltd (ABN 72 072 881 086 / AFS Licence 227263) (“Vanguard”) is the issuer of the Vanguard® Australian ETFs.
Vanguard ETFs will only be issued to Authorised Participants, that is persons who have been authorised as trading participants under the ASX Operating Rules ("Eligible
Investors"). Retail investors can transact in Vanguard ETFs through a stockbroker or financial adviser on the secondary market. Investors should consider the Product
Disclosure Statement in deciding whether to acquire Vanguard ETFs. Retail investors can only use the Product Disclosure Statement for informational purposes only. You can
access the Product Disclosure Statement on our website. Unless otherwise stated, all currencies shown in this document are in Australian dollars.
The funds or securities referred to herein are not sponsored, endorsed, or promoted by MSCI, and MSCI bears no liability with respect to any such funds or securities. The PDS
contains a more detailed description of the limited relationship MSCI has with Vanguard and any related funds.
© 2016 Vanguard Investments Australia, All rights reserved.
8212_082016
For the most up-to-date
fund data, please scan
the QR code below.


