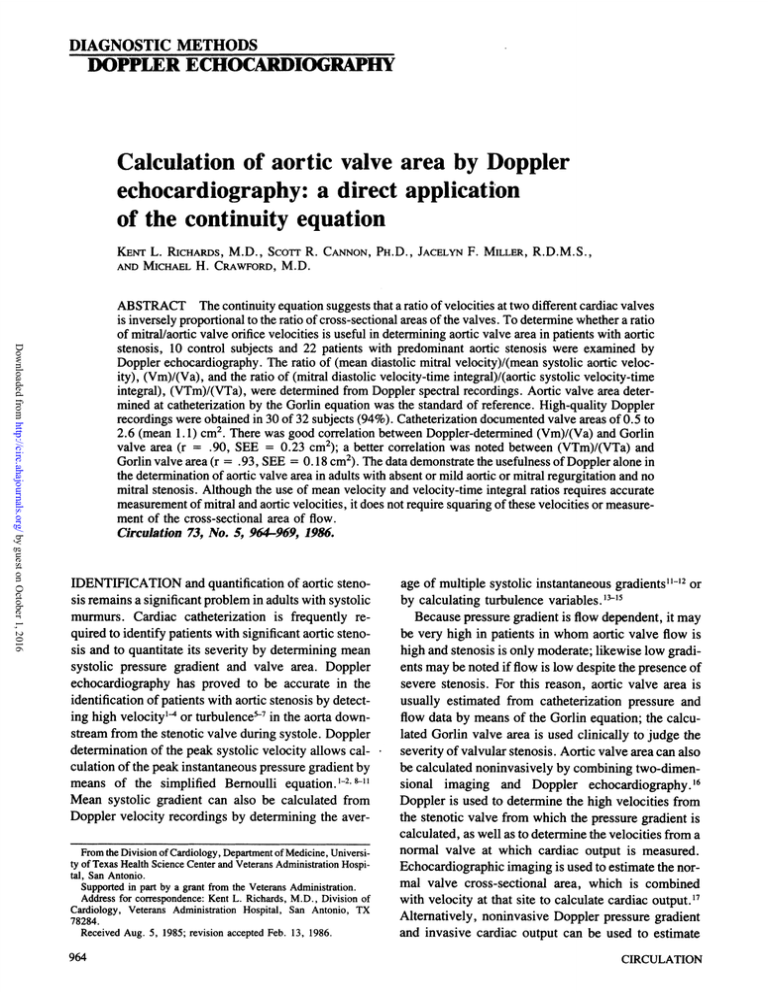
DIAGNOSTIC METHODS
DOPPLER ECHOCARDIOGRAPHY
Calculation of aortic valve area by Doppler
echocardiography: a direct application
of the continuity equation
KENT L. RICHARDS, M.D., ScoTr R. CANNON, PH.D., JACELYN F. MILLER, R.D.M.S.,
AND MICHAEL H. CRAWFORD, M.D.
Downloaded from http://circ.ahajournals.org/ by guest on October 1, 2016
ABSTRACT The continuity equation suggests that a ratio of velocities at two different cardiac valves
is inversely proportional to the ratio of cross-sectional areas of the valves. To determine whether a ratio
of mitral/aortic valve orifice velocities is useful in determining aortic valve area in patients with aortic
stenosis, 10 control subjects and 22 patients with predominant aortic stenosis were examined by
Doppler echocardiography. The ratio of (mean diastolic mitral velocity)/(mean systolic aortic velocity), (Vm)/(Va), and the ratio of (mitral diastolic velocity-time integral)/(aortic systolic velocity-time
integral), (VTm)/(VTa), were determined from Doppler spectral recordings. Aortic valve area determined at catheterization by the Gorlin equation was the standard of reference. High-quality Doppler
recordings were obtained in 30 of 32 subjects (94%). Catheterization documented valve areas of 0.5 to
2.6 (mean 1.1) cm2. There was good correlation between Doppler-determined (Vm)/(Va) and Gorlin
valve area (r
.90, SEE = 0.23 cm2); a better correlation was noted between (VTm)/(VTa) and
Gorlin valve area (r = .93, SEE = 0.18 cm2). The data demonstrate the usefulness of Doppler alone in
the determination of aortic valve area in adults with absent or mild aortic or mitral regurgitation and no
mitral stenosis. Although the use of mean velocity and velocity-time integral ratios requires accurate
measurement of mitral and aortic velocities, it does not require squaring of these velocities or measurement of the cross-sectional area of flow.
Circulation 73, No. 5, 964-969, 1986.
=
IDENTIFICATION and quantification of aortic stenosis remains a significant problem in adults with systolic
murmurs. Cardiac catheterization is frequently required to identify patients with significant aortic stenosis and to quantitate its severity by determining mean
systolic pressure gradient and valve area. Doppler
echocardiography has proved to be accurate in the
identification of patients with aortic stenosis by detecting high velocity's or turbulence-7 in the aorta downstream from the stenotic valve during systole. Doppler
determination of the peak systolic velocity allows calculation of the peak instantaneous pressure gradient by
means of the simplified Bernoulli equation. 12, 8-l
Mean systolic gradient can also be calculated from
Doppler velocity recordings by determining the averFrom the Division of Cardiology, Department of Medicine, University of Texas Health Science Center and Veterans Administration Hospital, San Antonio.
Supported in part by a grant from the Veterans Administration.
Address for correspondence: Kent L. Richards, M.D., Division of
Cardiology, Veterans Administration Hospital, San Antonio, TX
78284.
Received Aug. 5, 1985; revision accepted Feb. 13, 1986.
964
age of multiple systolic instantaneous gradients" -'2 or
by calculating turbulence variables.'-'-5
Because pressure gradient is flow dependent, it may
be very high in patients in whom aortic valve flow is
high and stenosis is only moderate; likewise low gradients may be noted if flow is low despite the presence of
severe stenosis. For this reason, aortic valve area is
usually estimated from catheterization pressure and
flow data by means of the Gorlin equation; the calculated Gorlin valve area is used clinically to judge the
severity of valvular stenosis. Aortic valve area can also
be calculated noninvasively by combining two-dimensional imaging and Doppler echocardiography. 16
Doppler is used to determine the high velocities from
the stenotic valve from which the pressure gradient is
calculated, as well as to determine the velocities from a
normal valve at which cardiac output is measured.
Echocardiographic imaging is used to estimate the normal valve cross-sectional area, which is combined
with velocity at that site to calculate cardiac output.'7
Alternatively, noninvasive Doppler pressure gradient
and invasive cardiac output can be used to estimate
CIRCULATION
DIAGNOSTIC METHODS-DOPPLER ECHOCARDIOGRAPHY
Downloaded from http://circ.ahajournals.org/ by guest on October 1, 2016
valve area. 18 Echocardiographic imaging alone has not
proved to be reliable for estimating aortic valve area. 19
The continuity equation provides a simple alternative by which Doppler alone can be used to calculate
aortic valve area. The concept is illustrated in figure 1,
in which blood flows steadily from left to right through
a cylinder with a cross-sectional area of (Al) at its left
end and a cross-sectional area of (A2) where it narrows. The rate at which blood flows through the large
section of the tube can be calculated by multiplying the
cross-sectional area of the tube (Al) by the mean velocity of blood at that site (V1). Likewise, the rate of
flow across the narrowed segment of the tube can be
calculated as the product of cross-sectional area (A2)
times mean velocity (V2) within the narrowed segment. The rate at which blood flows into the tube (Q1)
is the same as the rate at which blood flows out of the
tube (Q2) because there are no branches in the tube and
because flow occurs from left to right only. Mathematically, if (Q1) - (A 1)(V1) and (Q2) - (A2)(V2), and
Q1 = Q2, then:
QI
=
(AI)(V1)
=
(A2)(V2) -
(1)
Q2
If the equation is rearranged, a ratio of cross-sectional
areas (A2)/(A 1) is shown to be proportional to the
inverse ratio of velocities (VI)/(V2):
(A2)/(A1)
=
(VI)/(V2)
(2)
...0
AMTRAL
:EG
MIS
:
FIGURE 2. Pulsatile flow in the heart produces high velocities in the
aortic valve orifice during systole (top panel); diastolic velocities in the
mitral valve are normal (bottom panel). Electrocardiogram is shown for
time reference. The Doppler spectral recordings are graphed with time
in the x-axis (1 sec time lines), velocity in the y-axis (calibrations on the
right are in meters/sec), and signal amplitude in the z-axis (gray scale).
The aortic velocity-time integral (VTa) and mitral diastolic velocitytime integral (VTm) are shown as cross-hatching. Systolic aortic flow
time (Ts) and diastolic mitral flow time (Td) are used to calculate mean
aortic systolic (Va) and mean diastolic mitral (Vm) velocities: (Va)
(VTa)/(Ts); (Vm)
This model of the circulation can be applied to the
heart if we conceptualize the tube as beginning at the
normal mitral valve and ending at a stenotic aortic
valve. If aortic and mitral valve regurgitation are absent and intracardiac shunts are not present, the volume flow rate through aortic and mitral valves will be
equal. If the velocities and cross-sectional areas are
relabeled to represent the valve of origin (aortic = a,
mitral = m), then equation 2 becomes:
(Aa)/(Am)
Qi
V
AI-
Ql
=
Al Vi
=
(3)
(Vm)/(Va)
A2 -+
=
A2 V2
=
2
Q2
Q2
FIGURE 1. The continuity equation states that in a cylinder in which
flow is steady, if input flow rate (Q1) equals output flow rate (Q2), then
cross-sectional area at the entrance (Al) times velocity at that site (V1)
equals cross-sectional area at a second site (A2) times the velocity at that
site (V2).
Vol. 73, No. 5, May 1986
E...
v
=
(VTm)/(Td).
Thus, if the cross-sectional area of the mitral valve
(Am) is normal and the area of the aortic valve (Aa) is
small because of stenosis, the ratio of mean diastolic
velocity across the mitral valve (Vm) divided by mean
systolic velocity across the aortic valve (Va) will be
small. The reduction in the velocity ratio should be
proportional to the reduction in cross-sectional area of
the aortic valve.
An alternative approach that combines the continuity equation and concepts important in calculating
stroke volume with Doppler is based on the observation that volume/beat (Q) is proportional to the velocity-time integral (VT = area between the velocity
curve and zero as shown in figure 2) times the crosssectional area at the point at which velocity is mea-
sured20:
Q - (VT) (A)
(4)
If (VT) is substituted for (V) in equation 1, then the
following relationship is noted:
965
RICHARDS et al.
QI
=
(A1)(VT1)
=
(A2)(VT2)
=
Q2
(5)
By rearranging the equation into the form of equation
3, it is suggested that the ratio of valve areas of the
aortic and mitral valves will be inversely proportional
to the velocity-time integrals at the same valves:
(Aa)/(Am)
=
(VTm)/(VTa)
(6)
Downloaded from http://circ.ahajournals.org/ by guest on October 1, 2016
To evaluate the clinical utility of the ratios of mitral/
aortic orifice mean velocities and velocity-time integrals to identify patients with aortic stenosis and to
quantitate aortic valve area, three hypotheses were investigated: (1) The ratios (Vm)/(Va) and (VTm)/(VTa)
vary over a narrow range of values in patients who
have no valvular heart disease; (2) the ratios (Vm)/(Va)
and (VTm)/(VTa) allow accurate separation of individuals with aortic stenosis from those who do not
have aortic stenosis; and (3) the ratios (Vm)/(Va) and
(VTm)/(VTa) are directly proportional to aortic valve
area in patients with aortic stenosis.
Methods
Two separate patient groups were informed of the risks and
benefits of the study and signed consent forms approved by our
institutional review board. Group I consisted of 10 patients who
had no clinical evidence of valvular heart disease. Group II
consisted of 22 consecutive patients who had clinical indications for cardiac catheterization, had no more than mild aortic
and/or mitral regurgitation, and were proved to have aortic
stenosis by catheterization. Two patients were eliminated from
group II because of inadequate Doppler echocardiographic velocity tracings, resulting in a final total of 20 patients.
Cardiac catheterization was performed at rest with the patients in the fasting state. No premedication was given; intravenous meperidine hydrochloride (Demerol) was used to control
anxiety or relieve pain. Intravenous atropine and fluids were
used if bradycardia or hypotension occurred. Pressure gradients
were measured with dual micromanometer catheters passed retrograde across the aortic valve. Cardiac outputs were measured
with Fick and/or green dye indicator dilution technique at the
time of pressure gradient measurement. Aortic valve area was
calculated by the Gorlin equation.2` Left ventricular and aortic
root angiograms were obtained in all patients to determine the
severity of regurgitation.22 Results of catheterization were not
known by the individual analyzing the Doppler data.
Doppler echocardiography was performed with a 2.25 MHz
duplex high pulse repetition frequency Doppler ultrasonoscope
equipped with split crystal 2.00 MHz continuous-wave Doppler
(Advanced Technology Laboratory, Mark 600). Duplex standard and high pulse repetition frequency Doppler were used to
detect and quantify mitral valve orifice velocities. The highest
mitral valve velocities were recorded by placing the transducer
at the cardiac apex and aligning the ultrasound beam and sample
volume so as to acquire the highest Doppler frequency shifts.
Aortic valve systolic velocities were quantified by continuouswave Doppler; apical and occasionally right parasternal windows were used to detect the highest Doppler frequency shift.
Doppler studies were performed within 48 hr of cardiac catheterization.
Aortic and mitral velocities were calculated with an assumed
Doppler angle of zero degrees. All velocity analyses were performed on spectral tracings recorded at paper speeds of 50 or
966
100 mm/sec with a strip-chart recorder (Advanced Technology
Laboratories, Model 130). Aortic valve systolic ejection time
(Ts) and mitral valve diastolic flow time (Td) were determined
as shown in figure 2. Aortic and mitral velocity-time integrals
were calculated by determining the area between the zero baseline and the peak spatial velocities throughout systole and diastole, respectively (figure 2). The aortic velocity-time integral
(VTa) was divided by the systolic ejection time (Ts) to determine aortic mean systolic velocity (Va). The mitral velocitytime integral (VTm) was divided by the diastolic flow period
(Td) to determine mitral mean diastolic velocity (Vm). All
Doppler spectral tracing calculations were made with a digitizing tablet (Summagraphics Model ID-2-CTR-111) and a microcomputer (IBM-PC). All reported measurements represent the
average of 3 consecutive beats. Duplicate measurements of
Doppler data were made by a single observer and by two independent observers to allow analysis of both intraobserver and
interobserver measurement variability.
The ratios of (Vm)/(Va) and (VTm)/(VTa) were regressed
against catheterization-determined Gorlin aortic valve areas by
of linear regression analysis. To verify that mean values
for (Vm)/(Va) and (VTm)/(VTa) were significantly different in
group I vs group II, the paired Student's t test was used. A oneway analysis of variance for repeated measures was performed
to test both interobserver and intraobserver measurement variability. In addition, each measurement was compared with its
companion by linear regression analysis to ascertain any systematic differences between observations. All mean values are
expressed with standard deviation; p < .05 was considered
statistically significant.
means
Results
At cardiac catheterization, patients from group II
had micromanometer-determined mean systolic pressure gradients of 8 to 70 mm Hg (mean 36) and-cardiac
outputs of 2.9 to 7.5 liters/min (mean
5.5). Gorlin
valve areas ranged from 0.5 to 2.6 cm2 (mean 1.1 +
0. 5). Nineteen of the 20 patients had mild aortic and/or
mitral regurgitation by angiography. Table 1 summarizes the quantitative catheterization and Doppler
echocardiographic findings. The mean values for mitral/aortic mean velocity, (Vm)/(Va), and velocitytime integral ratio, (VTm)/(VTa), were significantly
different in groups I and II (p < .01 for both). Both
ratios allowed complete separation of individuals in
the two groups. As shown in table 1, standard deviations in the control group for (Vm)/(Va) and
(VTm)/(VTa) were both small (0.07 and 0.08, respectively).
Figures 3 and 4 display the (Vm)/(Va) and (VTm)/
(VTa) ratios determined by Doppler vs the aortic valve
area determined by the Gorlin equation at cardiac catheterization. There was a good linear correlation between Gorlin aortic valve area and (Vm)/(Va), (r =
.90, SEE = 0.23 cm2). A slightly better correlation
with Gorlin valve area was noted when (VTm)/(VTa)
was evaluated (r = .93, SEE = 0. 18 cm2). It is important to realize that aortic valve area was quantitated
accurately by Doppler alone despite the presence of
CIRCULATION
DIAGNOSTIC METHODS-DOPPLER ECHOCARDIOGRAPHY
TABLE 1
Results of cardiac catheterization and Doppler echocardiography
Control (n
=
Aortic stenosis (n
10)
=
20)
Catheterization
8-70 (36)
2.9-7.5 (5.5)
0.5-2!6 (1.1)
APs (mm Hg)
CO (1/min)
AVA (cm2)
Doppler
(Vm)/(Va)
(VTm)/(VTa)
.333,.500 (x
.620-.855 (x
=
=
.100-.262 (x
.101-.440 (x
.441; s = .07)
.733; s = .08)
APs = peak instantaneous pressure gradients; CO
deviation.
ASignificant, p < .01.
=
.140; s
.210; s
=
=
.05)A
.08)A
=
=
cardiac output; AVA - aortic valve area; x = mean; s = standard
Downloaded from http://circ.ahajournals.org/ by guest on October 1, 2016
mild aortic and/or mitral regurgitation in 19 of the 20
patients.
The data show that aortic valve area (AVA) can be
accurately quantified noninvasively from either the
mitral/aortic mean velocity ratio or velocity-time integral ratio by the following equations, which require
only Doppler echocardiographic measurements:
AVA = 9.35 (Vm)/(Va) - 0.19 mean velocity equation
AVA = 5.6 (VTm)/(VTa) velocity-time integral equation
The latter equation is preferred because of a slightly
higher correlation coefficient and slightly smaller standard error of the estimate. In addition, the slope of the
line of correlation is steeper with the velocity-time
integral equation, which permits better separation of
individuals with moderate and severe aortic stenosis.
The (VTm)/(VTa) values measured by the same observer on two occasions were not significantly different by analysis of variance. The mean difference was
0.006 or 3% of the first observation; the correlation
coefficient between values was .99 with a standard
error of the estimate of 0.009. Similar values were
obtained for (Vm)/(Va): mean difference 0.003 (2%), r
= .99 and SEE = 0.005. The (VTm)/(VTa) values
measured by two different observers were also not
statistically different: mean difference 0.011 (5%), r
= .99 and SEE = 0.012. Similar results were obtained for (Vm)/(Va): mean difference 0.008 (6%), r
= .99 and SEE = 0.008. Thus both the intraobserver
and interobserver reproducibility of these measurements were good.
Discussion
Current Doppler echocardiographic techniques allow accurate noninvasive determination of the peak
instantaneous pressure gradients across stenotic aortic
valves in most adults. 14 9-14 Although this is extremely
helpful, Doppler pressure gradients alone have not
eliminated the need for hemodynamic evaluation in
patients with aortic stenosis because (1) pressure gradients are flow dependent and do not always reveal the
.400
.250
.300
.200
VTm/VTa
Vm/Va
.200
.150
R
R
*
AVA
=
=
.90, SEE
9.35 (Vm)/(Va)
=
.23
.19
*
1.0
0.5
1.5
2.0
2.5
GORLIN AORTIC VALVE AREA
FIGURE 3. The ratio of Doppler-determined mean diastolic mitral
velocity divided by mean systolic aortic velocity (Vm)/(Va) correlates
well with aortic valve areas determined by the Gorlin equation at catheterization. Valve areas are in square centimeters and can be calculated
from Doppler data by the regression equation shown.
Vol. 73, No. 5, May 1986
.93, SEE
5.6
=
.18
(VTm)/(VTa)
.100
0.5
.100
AVA
=
=
1.0
1.5
2.0
2.5
GORLIN AORTIC VALVE AREA
FIGURE 4. The ratio of Doppler-determined mitral diastolic velocitytime integral divided by aortic systolic velocity-time integral
(VTm)/(VTa) correlates well with aortic valve areas determined by the
Gorlin equation at catheterization. Valve areas are in square centimeters
and can be calculated from Doppler data by the regression equation
shown.
967
RICHARDS et al.
Downloaded from http://circ.ahajournals.org/ by guest on October 1, 2016
severity of aortic stenosis; (2) pressure gradients obtained at noninvasive study frequently differ from
those determined at cardiac catheterization because of
differences in hemodynamics at the times of the nonsimultaneous catheterization and Doppler studies23; (3)
the peak instantaneous pressure gradient calculated by
the simple Bernoulli equation (AP - 4 V2) is not the
same pressure gradient determined at catheterization
(peak instantaneous vs peak-to-peak or mean systolic
gradient); and (4) Doppler pressure gradients can seriously underestimate the actual gradient if the Doppler
angle is more than 30 degrees because the error in
velocity measurement is squared.'2
The continuity equation provides a method by which
aortic valve area, a measure commonly derived at catheterization, can be calculated directly from Doppler
velocity recordings. Determination of valve area, rather than pressure gradient, has the advantage of providing an index of severity of aortic stenosis that is theoretically independent of changes in valve flow2' and
thus should be more stable under the different hemodynamic conditions encountered in the invasive vs noninvasive laboratories. If the equations provided are used,
aortic valve area is calculated in square centimeters,
the same unit used for reporting valve area at catheterization.
As with other Doppler techniques that quantitate
velocity, the transducer must be aligned parallel to the
velocity vectors from the valve. Failure to do so leads
to underestimation of true valve orifice velocity if the
Doppler angle is assumed to be zero. When the mitral/
aortic velocity or velocity-time integral ratios are used
to calculate aortic valve areas, underestimation of mitral velocity results in underestimation of true valve
area; underestimation of aortic velocity results in overestimation of valve area. The error induced in valve
area calculations by a larger-than-anticipated Doppler
angle is linear. The linear error induced in the continuity equation by underestimation of true velocity is
smaller than the error that would be anticipated in a
pressure gradient calculated from the Bernoulli equation, in which the same velocity is squared.
Alternative echocardiographic techniques that use
the Gorlin equation to determine aortic valve area require calculation of both cardiac output and stenotic
valve pressure gradient. 16 If the mitral valve is used as
the site of volume flow measurement, it is assumed
that mitral and aortic valve flows are equal; thus, mitral and aortic regurgitation must be small or absent.
Two Doppler velocity measurements (aortic and mitral
valve orifice) and two imaging measurements (two
dimensional and M mode determination of mitral valve
968
cross-sectional area) are required.'6, Although the
pressure grad'ient infornation is accurate,>'4 measurement of the average diastolic mitral, valve cross-sectional area is frequently difficult in adults..The alternative approach of combining IDoppler aprtic valve
pressure gradients with cardiac output determined by
thermodilution is accurate'8 but requires right heart
catheterization and is not suitable for screening. large
numbers of patients with systolic murmurs. The technique we propose requires only two velocity measurements; imaging is not necessary. In addition, it is totally noninvasive and thus avoids the need for right heart
catheterization to determine cardiac output.
Direct application of the continuity equation'to determine valve area requires that the flow rate across
both the stenotic valve and the valve used to derive the
velocity ratio (the index valve) be equal.'Thus valve
regurgitation involving .either valve must be mild 'or
absent. Furthermnore, the index valve must be free.of
stenosis. Fortunately, thorough Doppler examination
can accurately identify regurgitation or stenosis of the
index valve and regurgitation of the stenotic valve7 as
well as exclude the presence of intracardiac shunts.2426
Doppler also allows identification of -patients with
moderate and severe regurgitation27' 28 who should be
evaluated by other techniques.'8, 29 Further research is
required to determine whether the tricuspid and pulmonic valves will serve as alternative index valve sites
when mitral regurgitation is moderate.or severe.
The concepts presented illustrate the application of
the continuity equation to the clinical problem of quantifying aortic valve area echocardiographically. The
approach requires determination of simple variables
(velocity-time integrals or mean temporal ve.locities)
from Doppler alone. Although these Doppler estimates
of valve area have not been compared with direct determination of aortic valve area at surgery, they correlate well with a clinically useful standard of reference,
the Gorlin valve area. Interestingly, the greatest differences between Doppler and Gorlin valve areas in our
study were noted in individuals with Gorlin aortic
valve areas below 1.5 cm2, a population in which Gorlin valve areas may be inaccurate.30 In conclusion,
this study demonstrates a simple method for determining aortic valve area in which accurate measurement of aortic and mitral valve orifice velocities is
required, but in which neither squaring of velocities
nor measurement of mean flow cross-sectional areas is
required.
The members of the cardiac catheterization research team
who were instrumental in this project include David Foster,
CIRCULATION
DIAGNOSTIC METHODS-DOPPLER ECHOCARDIOGRAPHY
Michael Lujan, Donna Luna, Evelyn Saunders-Webb, and
Charles Sandefur.
References
Downloaded from http://circ.ahajournals.org/ by guest on October 1, 2016
1. Hatle L, Angelsen BA, Tromsdal A: Noninvasive assessment of
aortic stenosis by Doppler ultrasound. Br Heart J 43: 284, 1980
2. Hatle L: Noninvasive assessment and differentiation of left ventricular outflow tract obstruction with Doppler ultrasound. Circulation
64: 381, 1981
3. Spencer MP, Fujioka W: Continuous wave Doppler spectral analysis in acquired valve disease. In Spencer MR, editor: Cardiac
Doppler diagnosis. Boston, 1983, Martinus Nijhoff Publishers
4. Lima CO, Sahn DJ, Valdes-Cruz LM, Allen HD, Goldberg SJ,
Grenadier E, Barron JV: Prediction of the severity of left ventricular outflow tract obstruction by quantitative two-dimensional echocardiographic Doppler studies. Circulation 68: 348, 1983
5. Johnson SL, Baker DW, Lute RA, Dodge HT: Doppler echocardiography: the localization of cardiac murmurs. Circulation 48: -810,
1973
6. Young JB, Quinones MA, Waggoner AD, Miller RR: Diagnosis
and quantification of aortic stenosis with pulsed Doppler echocardiography. Am J Cardiol 45: 412, 1981
7. Richards KL, Cannon SR, Crawford MH, Sorensen SG: Noninvasive diagnosis of aortic and mitral disease with pulsed Doppler
spectrum analysis. Am J Cardiol 51: 1122, 1983
8. Holen J, Aaslid R, Landmark K, Simonsen S: Determination of
pressure gradient in mitral stenosis with a noninvasive ultrasound
Doppler technique. Acta Med Scand 199: 455, 1976
9. Stamm RB, Martin RP: Quantification of pressure gradients across
stenotic valves by continuous wave Doppler ultrasound. J Am Coll
Cardiol 2: 707, 1983
10. Berger M, Berdoff RL, Gallerstein PE, Goldberg E: Evaluation of
aortic stenosis by continuous wave Doppler ultrasound. J Am Coll
Cardiol 3: 150, 1984
11. Currie PJ, Seward JB, Reeder GS, Vlietstra RE, Bresnahan DR,
Bresnahan JF, Smith HC, Hagler DJ, Tajik AJ: Continuous-wave
Doppler echocardiographic assessment of severity of calcific aortic
stenosis: a simultaneous Doppler-catheter correlative study in 100
adult patients. Circulation 71: 1162, 1985
12. Hatle L, Angelsen B: Doppler ultrasound in cardiology: physical
principles and clinical applications. Philadelphia, 1984, Lea &
Febiger
13. Cannon SR, Richards KL, Rollwitz WT: Digital Fourier techniques
in the diagnosis of aortic stenosis with pulsed Doppler echocardiography. J Clin Ultrasound 10: 101, 1982
14. Richards KL, Cannon SR, Crawford MH: Pulsed Doppler echocardiographic assessment of the severity of aortic stenosis. In Peronneau P, Dieboldt B, editors: Cardiovascular applications of Doppler echocardiography. Paris, 1983, INSERM
Vol. 73, No. 5, May 1986
15. Cannon SR, Richards KL, Morgann RG: Comparison of Doppler
echocardiographic peak frequency and turbulence parameters in
quantifying aortic stenosis in a pulsatile flow model. Circulation
71: 129, 1985
16. Kosturakis D, Allen HD, Goldberg SJ, Sahn DJ, Valdes-Cruz LM:
Noninvasive quantification of stenotic semilunar valve areas by
Doppler echocardiography. J Am Coil Cardiol 3: 1256, 1984
17. Fisher DC, Sahn DJ, Friedman MJ, Larson D, Valdes-Cruz LM,
Horowitz S, Goldberg SJ, Allen HD: The mitral valve orifice
method for noninvasive two-dimensional echo determination of
cardiac output. Circulation 67: 872, 1983
18. Warth DC, Stewart WJ, Block PC, Weyman AE: A new method to
calculate aortic valve area without left heart catheterization. Circulation 70: 978, 1984
19. Demaria AN, Bommer W, Joye J, Lee G, Bouteller J, Mason DT:
Value and limitations of cross-sectional echocardiography in the
diagnosis and quantification of valvular aortic stenosis. Circulation
62: 304, 1980
20. Huntsman LL, Stewart DK, Barnes SK, Franklin SB, Colocousis
JS, Hessel EA: Noninvasive Doppler determination of cardiac output in man - clinical validation. Circulation 67: 593, 1983
21. Gorlin R, Gorlin SG: Hydraulic formula for calculation of the area
of the stenotic mitral valve, other cardiac valves, and central circulatory shunts. Am Heart J 41: 1, 1951
22. Grossman W, editor: Cardiac catheterization and angiography, ed
2. Philadelphia, 1980, Lea & Febiger
23. Stevenson JG, Kawabori I, French JW: Critical importance of
sedation when measuring pressure gradient by Doppler. Circulation 70 (suppl II): 11-116, 1984
24. Stevenson JG, Kawabori I, Dooley, et al: Diagnosis of ventricular
septal defect by pulsed Doppler echocardiography: sensitivity,
specificity, and limitations. Circulation 58: 322, 1978
25. Stevenson JG, Kawabori I, Guntheroth WG: Pulsed Doppler echocardiographic diagnosis of patent ductus arteriosus: sensitivity,
specificity, limitations and technical features. Cathet Cardiovasc
Diagn 6: 255, 1980
26. Goldberg SJ, Areias JC, Spitaels SEC, DeVilleneuve VH: The use
of time interval histographic output from echo-Doppler to detect
left-to-right atrial shunts. Circulation 58: 147, 1978
27. Abassi AS, Allen MW, DeCristofaro D, Ungar I: Detection and
estimation of the severity of mitral regurgitation by range-gated
pulsed Doppler echocardiography. Circulation 61: 143, 1980
28. Ciobanu M, Abassi AS, Allen MW, Hermer A, Spellberg R:
Pulsed Doppler echocardiography in the diagnosis and estimation
of severity of aortic insufficiency. Am J Cardiol 49: 339, 1982
29. Otto CM, Comess KA, Pearlman AS, Prestley RM, Janko CL:
Doppler determination of the severity of aortic stenosis in adults.
Circulation 70 (suppl 1I): 11-115, 1984
30. Cannon SR, Richards KL, Crawford MH: Hydraulic estimation of
stenotic orifice area: a correction of the Gorlin formula. Circulation
71: 1170, 1985
969
Calculation of aortic valve area by Doppler echocardiography: a direct application of the
continuity equation.
K L Richards, S R Cannon, J F Miller and M H Crawford
Downloaded from http://circ.ahajournals.org/ by guest on October 1, 2016
Circulation. 1986;73:964-969
doi: 10.1161/01.CIR.73.5.964
Circulation is published by the American Heart Association, 7272 Greenville Avenue, Dallas, TX 75231
Copyright © 1986 American Heart Association, Inc. All rights reserved.
Print ISSN: 0009-7322. Online ISSN: 1524-4539
The online version of this article, along with updated information and services, is located on
the World Wide Web at:
http://circ.ahajournals.org/content/73/5/964
Permissions: Requests for permissions to reproduce figures, tables, or portions of articles originally
published in Circulation can be obtained via RightsLink, a service of the Copyright Clearance Center, not the
Editorial Office. Once the online version of the published article for which permission is being requested is
located, click Request Permissions in the middle column of the Web page under Services. Further
information about this process is available in the Permissions and Rights Question and Answer document.
Reprints: Information about reprints can be found online at:
http://www.lww.com/reprints
Subscriptions: Information about subscribing to Circulation is online at:
http://circ.ahajournals.org//subscriptions/

