Spectral analysis of a PWM signal
advertisement

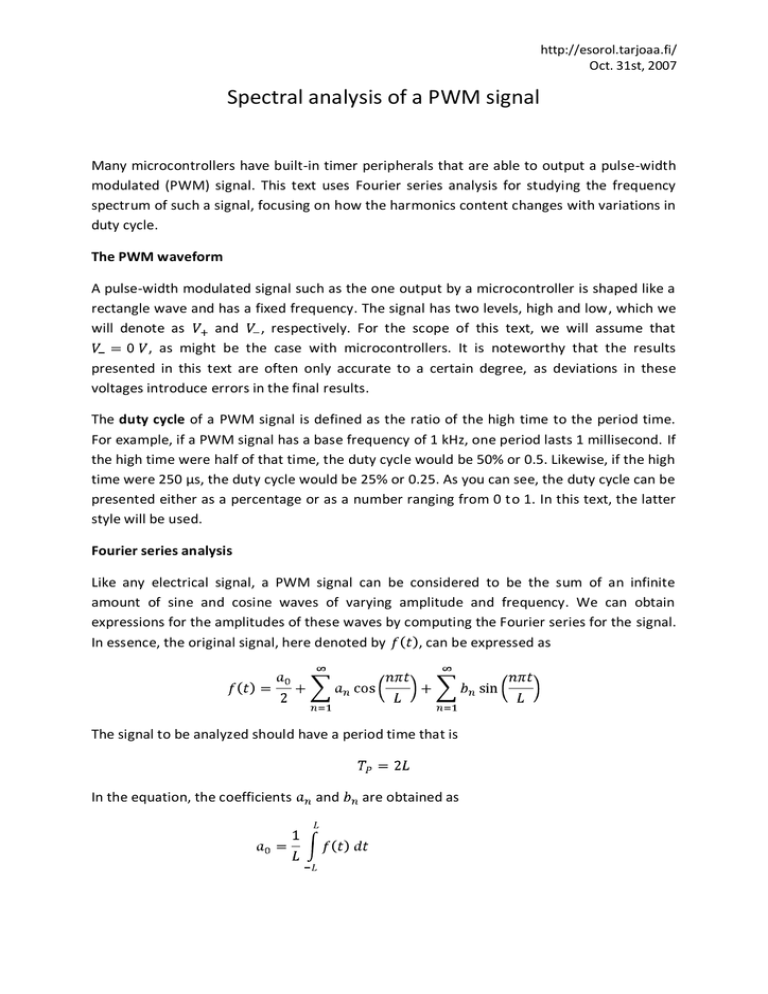
http://esorol.tarjoaa.fi/ Oct. 31st, 2007 Spectral analysis of a PWM signal Many microcontrollers have built-in timer peripherals that are able to output a pulse-width modulated (PWM) signal. This text uses Fourier series analysis for studying the frequency spectrum of such a signal, focusing on how the harmonics content changes with variations in duty cycle. The PWM waveform A pulse-width modulated signal such as the one output by a microcontroller is shaped like a rectangle wave and has a fixed frequency. The signal has two levels, high and low, which we will denote as and , respectively. For the scope of this text, we will assume that , as might be the case with microcontrollers. It is noteworthy that the results presented in this text are often only accurate to a certain degree, as deviations in these voltages introduce errors in the final results. The duty cycle of a PWM signal is defined as the ratio of the high time to the period time. For example, if a PWM signal has a base frequency of 1 kHz, one period lasts 1 millisecond. If the high time were half of that time, the duty cycle would be 50% or 0.5. Likewise, if the high time were 250 μs, the duty cycle would be 25% or 0.25. As you can see, the duty cycle can be presented either as a percentage or as a number ranging from 0 to 1. In this text, the latter style will be used. Fourier series analysis Like any electrical signal, a PWM signal can be considered to be the sum of an infinite amount of sine and cosine waves of varying amplitude and frequency. We can obtain expressions for the amplitudes of these waves by computing the Fourier series for the signal. In essence, the original signal, here denoted by , can be expressed as The signal to be analyzed should have a period time that is In the equation, the coefficients and are obtained as http://esorol.tarjoaa.fi/ Oct. 31st, 2007 The coefficient corresponds to the DC offset component of the signal. The and coefficients describe the amplitudes of the fundamental frequency sine and cosine waves, while coefficients with rising indices relate to harmonics of the fundamental frequency. For our calculations we will select and define our PWM signal as This simplifies our equations to From these equations, we are able to calculate the following expressions for the amplitudes of the fundamental frequency and the harmonics (only up to the fifth harmonic below): http://esorol.tarjoaa.fi/ Oct. 31st, 2007 This indicates that high-frequency harmonics have small amplitude, compared to the fundamental frequency and low harmonics. Of all frequency components, the fundamental frequency is the one with the largest amplitude. Below is provided a graph of the amplitudes of the fundamental frequency (red) and the second through fifth harmonics of a PWM signal, dependent on the duty cycle of the signal. In this case, and . If the high level voltage were increased, the amplitudes in the graph would be scaled accordingly, though the maximums and minimums would remain in the position they are. The green, blue, yellow, and cyan graphs are the 2 nd, 3rd, 4th, and 5 th harmonics in that order. The duty cycle ranges from 0 (output always low) to 1 (output always high). A duty cycle of 0.5 corresponds to a square wave. From the graph, it can be seen that the fundamental frequency has its highest amplitude when the duty cycle is 0.5. Also, it can be seen that the amplitude of the second harmonic peaks at the duty cycle is either 0.25 or 0.75. http://esorol.tarjoaa.fi/ Oct. 31st, 2007 For example, if a PWM signal with the specified voltages has a base frequency of 10 kHz and a duty cycle of 0.3, then it will contain the following frequency components: • • • • • Fundamental frequency, 10 kHz, amplitude roughly 2.6 V Second harmonic, 20 kHz, amplitude roughly 1.5 V Third harmonic, 30 kHz, amplitude roughly 0.3 V Fourth harmonic, 40 kHz, amplitude roughly 0.5 V Fifth harmonic, 50 kHz, amplitude roughly 0.6 V There will be an infinite amount of harmonics present; however their respective amplitudes never increase to the levels of the fundamental frequency and second harmonic. The amplitude for any given harmonic can be calculated using the expression for . The frequency for any harmonic is given by Where is the PWM base frequency.


