SINE WAVE CANCELATION THROUGH A PERIODIC TRANSFER
advertisement
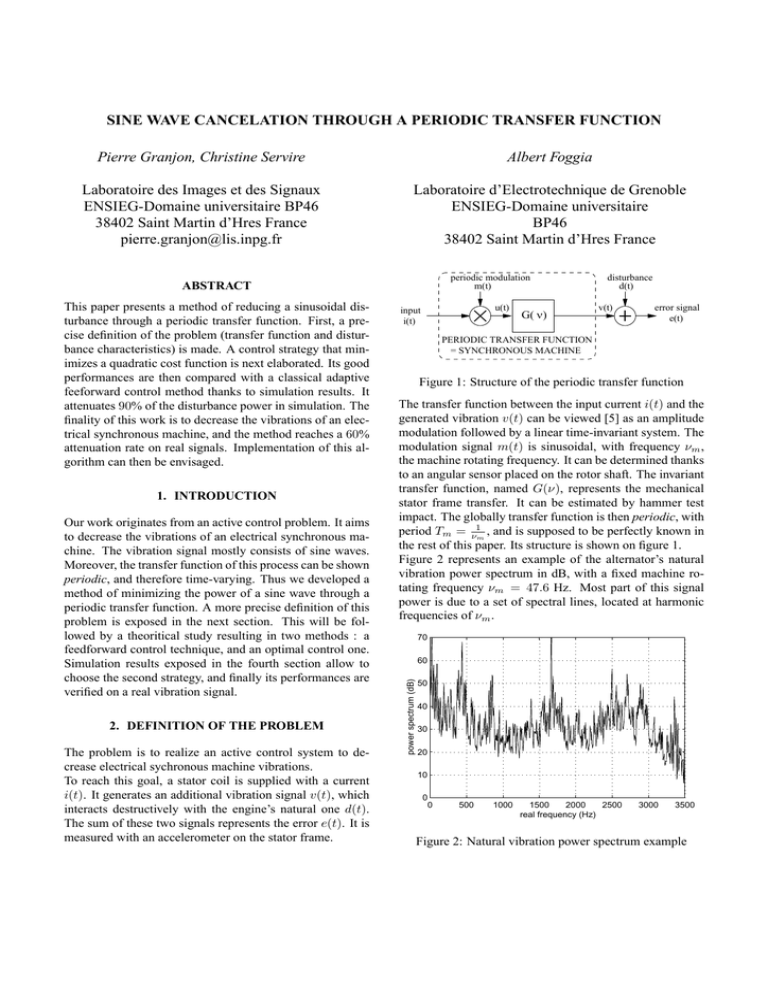
SINE WAVE CANCELATION THROUGH A PERIODIC TRANSFER FUNCTION Pierre Granjon, Christine Servire Albert Foggia Laboratoire des Images et des Signaux ENSIEG-Domaine universitaire BP46 38402 Saint Martin d’Hres France pierre.granjon@lis.inpg.fr Laboratoire d’Electrotechnique de Grenoble ENSIEG-Domaine universitaire BP46 38402 Saint Martin d’Hres France periodic modulation m(t) ABSTRACT 1. INTRODUCTION Our work originates from an active control problem. It aims to decrease the vibrations of an electrical synchronous machine. The vibration signal mostly consists of sine waves. Moreover, the transfer function of this process can be shown periodic, and therefore time-varying. Thus we developed a method of minimizing the power of a sine wave through a periodic transfer function. A more precise definition of this problem is exposed in the next section. This will be followed by a theoritical study resulting in two methods : a feedforward control technique, and an optimal control one. Simulation results exposed in the fourth section allow to choose the second strategy, and finally its performances are verified on a real vibration signal. 2. DEFINITION OF THE PROBLEM The problem is to realize an active control system to decrease electrical sychronous machine vibrations. To reach this goal, a stator coil is supplied with a current i(t). It generates an additional vibration signal v(t), which interacts destructively with the engine’s natural one d(t). The sum of these two signals represents the error e(t). It is measured with an accelerometer on the stator frame. u(t) input i(t) G( ν ) v(t) error signal e(t) PERIODIC TRANSFER FUNCTION = SYNCHRONOUS MACHINE Figure 1: Structure of the periodic transfer function The transfer function between the input current i(t) and the generated vibration v(t) can be viewed [5] as an amplitude modulation followed by a linear time-invariant system. The modulation signal m(t) is sinusoidal, with frequency νm , the machine rotating frequency. It can be determined thanks to an angular sensor placed on the rotor shaft. The invariant transfer function, named G(ν), represents the mechanical stator frame transfer. It can be estimated by hammer test impact. The globally transfer function is then periodic, with period Tm = ν1m , and is supposed to be perfectly known in the rest of this paper. Its structure is shown on figure 1. Figure 2 represents an example of the alternator’s natural vibration power spectrum in dB, with a fixed machine rotating frequency νm = 47.6 Hz. Most part of this signal power is due to a set of spectral lines, located at harmonic frequencies of νm . 70 60 power spectrum (dB) This paper presents a method of reducing a sinusoidal disturbance through a periodic transfer function. First, a precise definition of the problem (transfer function and disturbance characteristics) is made. A control strategy that minimizes a quadratic cost function is next elaborated. Its good performances are then compared with a classical adaptive feeforward control method thanks to simulation results. It attenuates 90% of the disturbance power in simulation. The finality of this work is to decrease the vibrations of an electrical synchronous machine, and the method reaches a 60% attenuation rate on real signals. Implementation of this algorithm can then be envisaged. disturbance d(t) 50 40 30 20 10 0 0 500 1000 1500 2000 2500 real frequency (Hz) 3000 3500 Figure 2: Natural vibration power spectrum example The whole system transfer function and disturbance characteristics description allows to state the problem in signal processing words : find a method of cancelling a sine wave with frequency k × νm (k ∈ N) through a periodic transfer function with frequency νm . Two of these methods are exposed in the next section. 3. THEORITICAL STUDY 3.1. Feedforward control with the FxLMS algorithm The time-varying property of the global transfer function leads to choose an adaptive method. Besides, feedforward control technique has been chosen to avoid stability problem. This structure is often selected in active control of noise or vibration applications [1] [2] because of its robustness, and its simplicity for digital signal processing implementation. This method is implemented in discrete time. All signals are then supposed to verify Shannon’s theorem in order to be correctly discretized. Its principle is detailed on figure 3. d(k) adaptive i(k) filter W • The algorithm used to update W . The filtered-x least mean square (FxLMS) algorithm, studied in [3] and [4], is used in this application thanks to its robustness and simplicity. Equation (1) recalls the filter coefficients adaptation law. W k+1 = W k + 2µ.e(k).Rk (1) µ is called the adaptation rate, and the vector Rk is composed of delayed versions of the reference signal x(k), filtered by the known periodic transfer function at time k. 3.1.2. Limits 3.1.1. Principle x(k) sine waves with frequencies νd and νd − 2νm . The νd frequency sinusoid is well correlated with the disturbance, and a good attenuation can be expected at that frequency. The second sinusoid induces a loss of performance for this method. global periodic transfer function v(k) e(k) The method’s weak points can be found from this description. The first one is due to the amplitude modulation signal m(t), which is occasionally null. During these moments, the global periodic transfer is no more inversible, and no attenuation of the disturbance can then be done. The second weak point is the generation of an undesired sine wave with a frequency νd − 2νm in e(k), which induces a poor attenuation rate of the disturbance. This problem is partly due to the reference signal choice. These observations are illustrated by simulation results exposed in the fourth section. Another control strategy must now be elaborated to avoid the problem of the undesirable sine wave generation. Figure 3: Principle of the feedforward control method 3.2. Optimal control The error signal e(k) is used to update an adaptive filter W . This filter, fed with a reference signal x(k), has to supply the system with the input i(k) to minimize e(k) in the mean square sense. W converges to an optimal stationary value only if the signals v(k) and d(k) are, at least, partially correlated. In such a case, only the correlated parts of these signals can be cancelled in e(k). The disturbance signal d(k) is now supposed to be a νd tone signal. Three unknown quantities have still to be determined: • The adaptive filter architecture. W is mostly chosen as a finite impulse response (FIR) filter for stability considerations. Therefore, filter coefficients at time k are represented as a vector: W k . • The reference signal x(k). It is chosen as a νx = νd − νm tone signal to have a maximum correlation between v(k) and d(k), and a maximum attenuation of d(k) in the error signal. Because of the sinusoidal amplitude modulation, v(k) is then composed of two To choose the previous control technique, the time-varying property of the system has been used. In this section, the characteristics of this variation are taken into account to increase the performances. 3.2.1. General properties of the signals The disturbance d(t) is known to be a periodic function, with frequency components located at k × νm (k ∈ N). To reach good performances, v(t) and d(t) have to be strongly correlated, or similarly they must have the same frequency range. The periodic transfer frequency is νm , and implies νm frequency shifts in the input signal spectrum. Therefore, the optimal input frequency components must be νm harmonics. From these considerations, we can say that all the signals of the system on figure 1 have frequency ranges limited to the νm harmonics, and then can be decomposed in Fourier series. The Fourier transform of analytical signals can now be written as dot products of infinite length vectors. The Fourier transform Zd (ν) of the analytical signal of d(t) is for example given by: Zd (ν) = 2 × n=+∞ X dn δ(ν − nνm ) = 2 × ∆H .D where £ ¤T ∆ = δ(ν) δ(ν − νm ) . . . δ(ν − N νm ) . . . £ ¤T D = d0 d1 . . . dN . . . ( H and T are respectively hermitian and standard transposes) D is the d(t) Fourier series coefficients vector, and δ(·) represents the Spike function. To avoid problems due to infinite length vectors, all signals are supposed to have null Fourier coefficients over N × νm Hertz. Vectors are then limited to their N + 1 first elements. 3.2.2. Error signal expression We assume that the signal m(t) = Am . cos(2πνm t + φm ) and the time-invariant part G(ν) of the whole transfer are perfectly known. The Fourier transform Ze (ν) of the analytical error signal can be expressed as a function of the input and disturbance Fourier series coefficients vectors I and D, and the transfer characteristics: £ ¤ (3) Ze (ν) = 2 × ∆H .E = 2 × ∆H . G.M.I + D where G= G(0) 0 .. 0 . C= (2) n=0 Pi . A cost function C consisting of the sum of these two power is chosen: G(N νm ) This matrix represents the time-invariant filter effect. It is diagonal because of the stationarity of this system. Am e+jφm Am e−jφm 0 0 2 2 .. .. .. M= . . . +jφm −jφm Am e Am e 0 0 2 2 This matrix represents the amplitude modulation part of the system, and is no more diagonal. A signal multiplication by a sinusoid is a time-varying process, and involves frequency shifts in the signal spectrum. This explains the shape of this matrix, easily obtained by computing the Fourier series of the signal u(t) on the figure 1. 3.2.3. Cost function The optimal command iopt (t) has to minimize the power Pe of the error signal, with a minimum amount of input power Pi Pe + γ. 2 2 (4) The real constant γ adjusts the part of the input power in this cost function. In the frequency domain, C can be expressed thanks to the integral of power spectrums of i(t) and e(t) analytical signals: Z +∞ Z +∞ Ze (ν)H .Ze (ν) Zi (ν)H .Zi (ν) C= dν + γ. dν 4 4 −∞ −∞ Using the following property: Z +∞ ∆H .∆dν = Id where Id is the identity matrix −∞ the cost function is expressed in terms of the disturbance and input Fourier series coefficients vectors, and the known system characteristics (M and G): h i C = IH . MH .GH .G.M + γ.Id .I h i h iH +IH . MH .GH .D + MH .GH .D .I (5) +DH .D hThis is a hermitian quadratic i form as explained in [1], where MH .GH .G.M + γ.Id is a hermitian matrix. The fisrt term of this expression is the power of the vibration signal generated by the input acting alone, summed with the fractionnal part of the input power. The last one is the power of the disturbance signal. These two terms are never negative. The middle one is the cross-power between v(t) and d(t). Therefore, if these two signals are totally uncorrelated, it’s impossible to minimize the cost function C. 3.2.4. Optimal input signal The hermitian quadratic form is known to have a unique global minimum if the hermitian matrix is positive definite. This condition can here always be realized thanks to γ. This global minimum is reached with the optimal Fourier series coefficients vector Iopt of the input signal: h i−1 .MH .GH .D (6) Iopt = − MH .GH .G.M + γ.Id This relation gives the Fourier coefficients of the optimal input signal, which is then easily determined by an inverse Fourier transform. 3.2.5. Algorithm The finality of this work is to implement this method with a digital signal processor. The optimal solution, given in 3.2.6. Limits According to the reasons exposed in section 3.1.2, no attenuation is expected during cancellation of the modulation signal. The first weak point of the feedforward control method is then still present. In counterpart, the mean square optimality of the solution allows to hope for better results for the undesired sine waves generated in the error signal. The attenuation rate, defined as the ratio between the error power, and the disturbance one, will then certainly decrease. Moreover, thanks to the description of the disturbance signal used in this section (its Fourier series coefficients vector D), d(t) can be a periodic signal which fundamental frequency is k ×νm , and not only a pure tone signal. In the next section, the results of these two control methods are compared, and the better one is applied on real rotating machine vibration signals. 4. SIMULATION RESULTS 4.1. Simulation characteristics The simulations, realized to study the two control strategy elaborated, have some common characteristics. • The modulation signal m(t) is a 50 Hz tone signal. • The time-invariant transfer function G(ν) presents two resonances (500 Hz and 1550 Hz), and three zeros (0 Hz, 1000 Hz and 5000 Hz). The same transfer is modelized, on the one hand, as an order 100 finite impulse response (FIR) filter for the feedforward control method, and on the other hand as an order 4 infinite impulse response (IIR) filter for the optimal control one. • The disturbance signal d(t) consists of a 1500 Hz tone signal, with a unitary power. input power error power 250 (7) C has a unique global minimum, so that this algorithm converges to the solution given in (6). Relation (7) is usually applied at each sample. The adaptive vector I generates here a periodic input signal i(t), so that this vector is updated here once a period (each ν1m seconds). El contains the Fourier series coefficients of the error signal valid for the present period, and is then easily processed. • The sampling frequency is fixed at 10000 Hz. 300 200 150 100 50 0 2 4 6 8 10 12 period number 14 16 18 20 (a) learning curve (percentage of disturbance power) 1 disturbance error 0.9 0.8 power spectrum (linear) Il+1 = (1 − 2µγ)Il − 2µMH .GH .El 350 percentage equation (6), contains D, but the only measured signal is e(t). In order to have a solution as a function of the error Fourier coefficients (E), and an adaptive solution instead of equation (6), a gradient descent algorithm, with a convergence rate µ, is derived from relation (5): 0.7 0.6 0.5 0.4 0.3 0.2 0.1 0 1200 1300 1400 1500 1600 real frequency (Hz) 1700 1800 (b) signal spectrums after convergence Figure 4: Feedforward control method 4.2. Feedforward control The results obtained with the feedforward strategy are shown on figure 4. The convergence rate is µ = 0.01. Figure 4(a) represents the evolution of the input (dashed line) and error (solid line) power versus time. The vertical scale is ”percentage of disturbance power”. The algorithm needs 800 samples to converge to the minimum value of the error power, which is about 40% of the disturbance one. Moreover, the final input power is 330% of the disturbance one. Figure 4(b) shows the disturbance (dashed line) and error (solid line) power spectrums after convergence. As expected, the disturbance spectral line, located at 1500 Hz, is well attenuated (about −10 dB), but an undesired one is created at 1400 Hz. In the end, this method reaches a 4 db attenuation rate, which is a middling performance. 4.3. Optimal control Figure 5 has the same arrangement than figure 4. The convergence rate is now µ = 0.1 and γ, defined in equation (4) is fixed at 0.05. The convergence time is about 4000 samples what is much greater than the last one. But this method reaches to attenuate about 90% of the disturbance power, with a final input power of 260%. Power spectra of figure 5(b) shows that the disturbance spectral line is well attenuated, and undesired ones, located at ν = 1400 Hz and ν = 1600 Hz are very small compared to the results of the 300 300 disturbance error input power error power cost function 250 power spectrum (linear) 250 percentage 200 150 100 150 100 50 50 0 200 0 20 40 60 period number 80 100 (a) learning curve (percentage of disturbance power) 0 1500 1550 1600 1650 1700 real frequency (Hz) 1750 1800 Figure 6: signal spectrums after convergence 1 disturbance error 0.9 5. CONCLUSION power spectrum (linear) 0.8 0.7 0.6 0.5 0.4 0.3 0.2 0.1 0 1200 1300 1400 1500 1600 real frequency (Hz) 1700 1800 (b) signal spectrums after convergence Figure 5: Optimal control method previous method. Moreover, by choosing different values for γ, these results can be modified. For small γ, very good attenuation rate can be obtained, to the prejudice of an increased input power. These simulations allow to choose the optimal control strategy thanks to its better performances (10 dB attenuation rate). It is now applied on real vibration signals. 4.4. Real signals The optimal control algorithm defined by equation (7) is applied to the vibration signal which spectrum is shown on figure 2. It has been measured on an alternator with a machine rotating frequency νm = 47.6 Hz. The stator frame transfer function is simulated with the same IIR filter as previouly. Only the 1666 Hz located spectral line is modified thanks to a bandpass filter applied to the error signal with a passband situated between 1000 Hz and 2000 Hz. Figure 6 shows the disturbance (dashed line) and error (solid line) spectrum after convergence. This method’s accuracy is verified. The algorithm reaches to attenuate more than 60% of the spectral line. This result is not as good as the previous simulation one, because of the noise part of the real vibration signal. The last step is to implement this algorithm in a digital signal processor to work it up on a real synchronous machine. A method of attenuating the power of a sine wave through a periodic transfer function has been elaborated. It processes an input signal, minimizing a cost function composed of the error power and a fractional part of the input power. The comparison of this optimal control strategy with an adaptive feedforward one brings out its superiority for a pure tone signal. Furthermore, it can be applied to a periodic disturbance, with a fundamental frequency equals to k × νm , which is a more general case than the sinusoidal one. Finally, its application on real rotating machine vibration signals reaches at least 60% attenuation rate of the disturbance power. The same performances are expected after implementation on a real alternator with a digital signal processor. 6. REFERENCES [1] P.A. Nelson S.J. Elliot., ”Active control of sound”, 1992, Academic Press [2] C.R. Fuller, S.J. Elliot and P.A. Nelson, ”Active control of vibration”, 1996, Academic Press [3] S.M. Kuo and D.R. Morgan, ”Active noise control systems, algorithms and DSP implementation”, 1996, Wiley interscience [4] S.D. Stearns B. Widrow., ”Adaptive signal processing”, 1985, Prentice-Hall [5] P. Granjon, C. Serviere and A. Foggia, ”Controle actif des vibrations d’une machine synchrone”, 1998, 3rd I.C. on acoustical and vibratory surveillance methods and diagnostic techniques, CETIM Senlis, 1998.

