Use of CRO (Supplementary)
advertisement

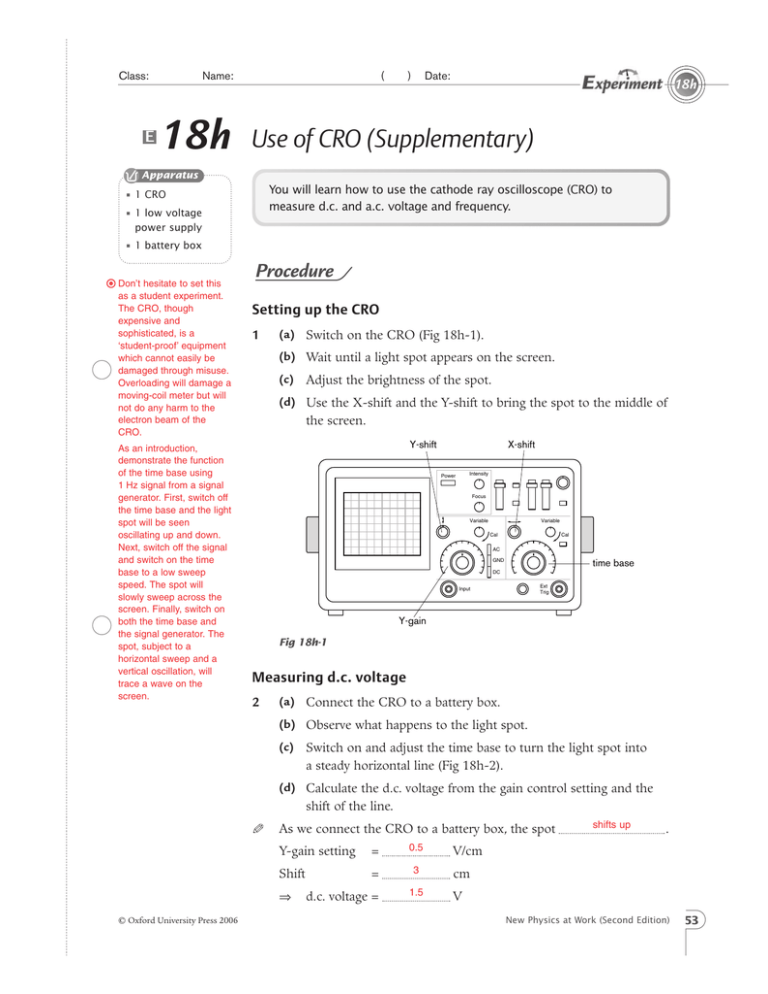
Class: E Name: 18h ( ) Date: 18h Use of CRO (Supplementary) Apparatus You will learn how to use the cathode ray oscilloscope (CRO) to measure d.c. and a.c. voltage and frequency. • 1 CRO • 1 low voltage power supply • 1 battery box Don’t hesitate to set this as a student experiment. The CRO, though expensive and sophisticated, is a ‘student-proof’ equipment which cannot easily be damaged through misuse. Overloading will damage a moving-coil meter but will not do any harm to the electron beam of the CRO. As an introduction, demonstrate the function of the time base using 1 Hz signal from a signal generator. First, switch off the time base and the light spot will be seen oscillating up and down. Next, switch off the signal and switch on the time base to a low sweep speed. The spot will slowly sweep across the screen. Finally, switch on both the time base and the signal generator. The spot, subject to a horizontal sweep and a vertical oscillation, will trace a wave on the screen. Procedure Setting up the CRO (a) Switch on the CRO (Fig 18h-1). 1 (b) Wait until a light spot appears on the screen. (c) Adjust the brightness of the spot. (d) Use the X-shift and the Y-shift to bring the spot to the middle of the screen. Y-shift X-shift Intensity Power Focus Variable Variable Cal Cal AC GND time base DC Ext Trig Input Y-gain Fig 18h-1 Measuring d.c. voltage (a) Connect the CRO to a battery box. 2 (b) Observe what happens to the light spot. (c) Switch on and adjust the time base to turn the light spot into a steady horizontal line (Fig 18h-2). (d) Calculate the d.c. voltage from the gain control setting and the shift of the line. As we connect the CRO to a battery box, the spot = 0.5 Shift = 3 ⇒ Y-gain setting © Oxford University Press 2006 d.c. voltage = 1.5 shifts up . V/cm cm V New Physics at Work (Second Edition) 53 18h Class: Before the measurements of voltage and frequency, ensure the variable knobs of the Y-gain and time base are fully turned clockwise respectively. Only when the voltage variable knob is fully clockwise (i.e. at the CAL position, where CAL means calibrated), the sensitivity indicated on the Y-gain can be used to calculate the unknown input voltage. The same applied to the variable knob of the time base. When the variable knob is at any other position, the CRO is merely used to display the waveform. The variable knob is there for the flexibility of attenuating the amplitude of the displayed waveform when needed. Name: ( ) Date: battery box Fig 18h-2 Measuring a.c. voltage 3 Connect the CRO to an a.c. power supply. Adjust the time base and Y-gain to display a proper waveform (Fig 18h-3). a.c. supply Fig 18h-3 4 waveform displayed (a) Switch off the time base and measure the length of the vertical trace (Fig 18h-4). peak voltage Fig 18h-4 54 New Physics at Work (Second Edition) time base switched off © Oxford University Press 2006 Class: Name: ( ) Date: 18h (b) Half the length gives the peak voltage of the a.c. (c) Calculate the peak voltage from the gain control setting of the CRO. Y-gain setting = 0.5 V/cm Length of vertical trace = 5.6 cm Half length of vertical trace = 2.8 cm ⇒ = 0.5 V/cm × = 1.4 V Peak voltage 2.8 cm Measuring frequency (a) Switch on the time base again to display the waveform of the a.c. voltage. 5 (b) Measure the width of several complete cycles of the wave. (c) Calculate the frequency. = 5 2.5 cycles = 10 cm Width of 1 cycle = 4 cm T= 5 m s/cm × = 20 ms= Time base setting Width of ⇒ ⇒ Period Frequency f= 1 = T m s/cm 50 4 0.02 cm s Hz Discussion What would happen to the waveform in step 3 if the Y-gain setting is changed from 0.5 V/cm to 1 V/cm? Sketch the waveform in Figure 18h-5. The amplitude (peak voltage) of the displayed waveform is halved, but the width of each cycle of the wave remains unchanged. Fig 18h-5 © Oxford University Press 2006 New Physics at Work (Second Edition) 55 18h Class: Name: ( ) Date: What would happen to the waveform in step 3 if the time base setting is changed from 5 m s/cm to 2 m s/cm? Sketch the waveform in Figure 18h-6. The amplitude (peak voltage) of the displayed waveform remains unchanged, but the width of each cycle of the wave increases. Fig 18h-6 The CRO is basically a voltmeter. It can be used to measure voltage the and waveform frequency and to display of the input voltage. Related questions in HKCEE 1999 Paper 2 Q32 The above diagram shows the trace of a signal on a CRO with the time base set at 10 ms cm–1 and Y-gain at 1 V cm–1. If the time base is changed to 20 ms cm–1 and Y-gain changed to 0.5 V cm–1, which of the following shows the trace of the signal on the CRO? A B D E C A 56 New Physics at Work (Second Edition) © Oxford University Press 2006 Class: Name: ( ) Date: 18h 2001 Paper 2 Q33 Y-gain Time- Y-shift base Figure (a) Y-gain Time- Y-shift base Figure (b) Figure (a) shows the trace of a signal on a CRO. In order to change the trace of the signal into the form shown in Figure (b), which of the following settings of the CRO should be adjusted? © Oxford University Press 2006 A Y-gain only. B Y-shift only. C time base only. D Y-gain and Y-shift. E Y-gain and time base. D New Physics at Work (Second Edition) 57


