“CIL allocates in inverse proportion to each stock`s daily volatility ”
advertisement
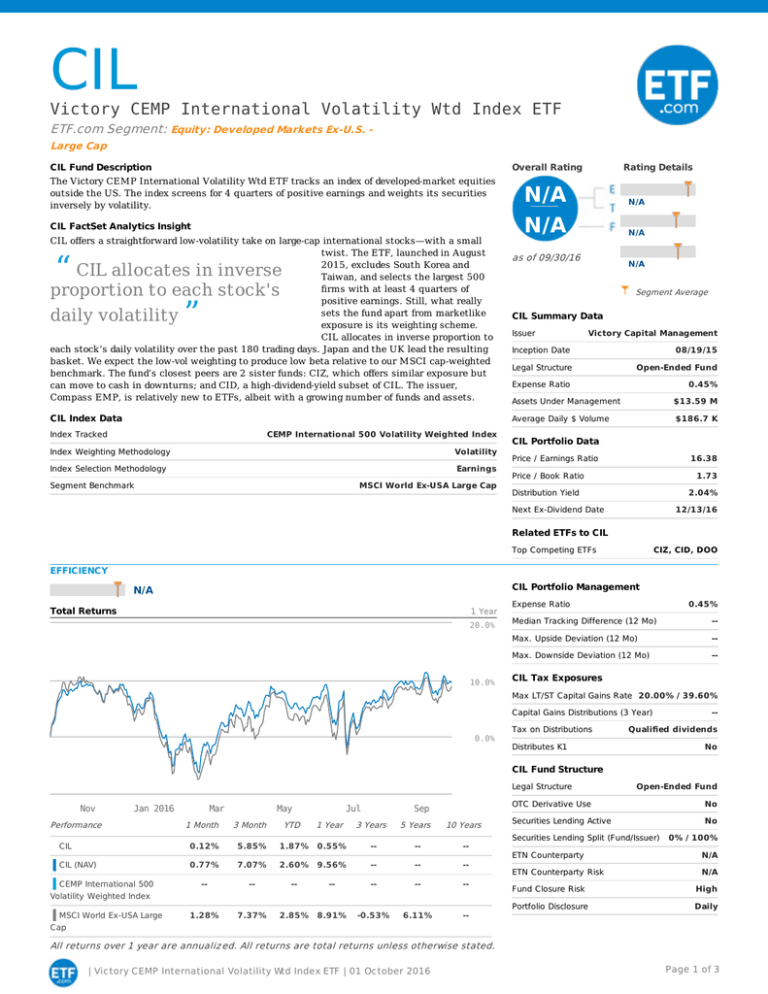
CIL VictoryCEMPInternationalVolatilityWtdIndexETF ETF.comSegment:Equity:DevelopedMarketsEx-U.S.LargeCap CILFundDescription OverallRating TheVictoryCEMPInternationalVolatilityWtdETFtracksanindexofdeveloped-marketequities outsidetheUS.Theindexscreensfor4quartersofpositiveearningsandweightsitssecurities inverselybyvolatility. CILFactSetAnalyticsInsight CILoffersastraightforwardlow-volatilitytakeonlarge-capinternationalstocks—withasmall twist.TheETF,launchedinAugust 2015,excludesSouthKoreaand Taiwan,andselectsthelargest500 firmswithatleast4quartersof positiveearnings.Still,whatreally setsthefundapartfrommarketlike exposureisitsweightingscheme. CILallocatesininverseproportionto eachstock’sdailyvolatilityoverthepast180tradingdays.JapanandtheUKleadtheresulting basket.Weexpectthelow-volweightingtoproducelowbetarelativetoourMSCIcap-weighted benchmark.Thefund’sclosestpeersare2sisterfunds:CIZ,whichofferssimilarexposurebut canmovetocashindownturns;andCID,ahigh-dividend-yieldsubsetofCIL.Theissuer, CompassEMP,isrelativelynewtoETFs,albeitwithagrowingnumberoffundsandassets. “ CILallocatesininverse proportiontoeachstock's dailyvolatility ” CILIndexData IndexTracked CEMPInternational500VolatilityWeightedIndex IndexWeightingMethodology Volatility IndexSelectionMethodology Earnings SegmentBenchmark MSCIWorldEx-USALargeCap RatingDetails N/A N/A N/A N/A asof09/30/16 N/A SegmentAverage CILSummaryData Issuer VictoryCapitalManagement InceptionDate 08/19/15 LegalStructure Open-EndedFund ExpenseRatio 0.45% AssetsUnderManagement $13.59M AverageDaily$Volume $186.7K CILPortfolioData Price/EarningsRatio 16.38 Price/BookRatio 1.73 DistributionYield 2.04% NextEx-DividendDate 12/13/16 RelatedETFstoCIL TopCompetingETFs CIZ,CID,DOO EFFICIENCY CILPortfolioManagement N/A TotalReturns 1Year 20.0% 10.0% ExpenseRatio 0.45% MedianTrackingDifference(12Mo) -- Max.UpsideDeviation(12Mo) -- Max.DownsideDeviation(12Mo) -- CILTaxExposures MaxLT/STCapitalGainsRate 20.00%/39.60% CapitalGainsDistributions(3Year) 0.0% TaxonDistributions -- Qualifieddividends DistributesK1 No CILFundStructure LegalStructure Nov Jan2016 Performance Mar 1Month May 3Month YTD Jul 1Year Sep 3Years 5Years 10Years CIL 0.12% 5.85% 1.87% 0.55% -- -- -- CIL(NAV) 0.77% 7.07% 2.60% 9.56% -- -- -- -- -- -- -- -- -- -- 1.28% 7.37% 2.85% 8.91% -0.53% 6.11% -- CEMPInternational500 VolatilityWeightedIndex MSCIWorldEx-USALarge Cap Open-EndedFund OTCDerivativeUse SecuritiesLendingActive SecuritiesLendingSplit(Fund/Issuer) ETNCounterparty ETNCounterpartyRisk No No 0%/100% N/A N/A FundClosureRisk High PortfolioDisclosure Daily Allreturnsover1yearareannualiz ed.Allreturnsaretotalreturnsunlessotherwisestated. |Vic toryCEMPInternationalVolatilityWtdIndexETF|01Oc tober2016 Page1of3 TRADABILITY N/A CILFactSetAnalyticsBlockLiquidity AVERAGESPREAD 3.6% 5 4 2.7% 3 1.8% 2 0.9% 1 0% Thismeasurementshows howeasyitistotrade 25,000sharesofC IL.C ILis rateda4outof5. CILTradability Avg.DailyShareVolume PREMIUM/DISCOUNT 10.0% 5,100 AverageDaily$Volume $186.7K MedianDailyShareVolume 0.0% 471 MedianDailyVolume($) $17.34K AverageSpread(%) 0.30% AverageSpread($) -10.0% $0.1 MedianPremium/Discount(12Mo) Max.Premium/Discount(12Mo) VOLUME 300K 200K 100K OCT `16 APR JUL 0.17% 6.14%/-4.32% ImpedimenttoCreations None MarketHoursOverlap 100.00% CreationUnitSize(Shares) 50,000 CreationUnit/Day(45DayAverage) `16 0.01 CreationUnitCost(%) 0.02% UnderlyingVolume/Unit 0.00% OpenInterestonETFOptions -- NetAssetValue(Yesterday) $33.72 ETF.comImpliedLiquidity 4 FIT CILBenchmarkComparison N/A CILSector/IndustryBreakdown S ec tor CILTop10Holdings CIL Benc hmark -- CIL 452Holdings SharedHoldings 238(Count) Financials 24.25% 21.87% Industrials 18.70% 12.11% ConsumerCyclicals 13.37% 12.18% ConsumerNon-Cyclicals 10.11% 12.90% Large Healthcare CILGeographicExposure 7.42% 13.59% (>12.9B) BasicMaterials Countries 6.72% 6.70% CIL Benc hmark TotalTop10Weighting 0.00% Regions CIL Benc hmark 23.71% 4.29% Europe 50.88% 63.47% Utilities UnitedKingdom 12.95% 5.74% 19.88% 3.22% Asia-Pacific 35.24% 33.31% Telecommunications Canada 10.08% 5.24% NorthAmerica 12.89% 2.94% 0.98% 0.28% 6.06% 2.87% Energy HongKong 2.03% 7.05% Switzerland 6.53% 10.22% Germany 5.84% 9.78% Australia 4.63% 7.57% Spain 3.14% 3.18% Other 11.86% 10.12% 7.08% 0.81% Benchmark 26.29B 67.46B 58.10% 90.21% Mid(>2.7B) 41.90% CILPerformanceStatistics S mall 0.00% 9.68% SizeSplit 19.19% 6.41% 8.84% CIL WeightedAverage MarketCap Technology Japan Services France Benchmark 436Constituents 52.20%(Weight) MiddleEast&Africa Developed/ EmergingSplit 100.00%/ 98.00%/ 0.00% 2.00% GoodnessofFit(R 2) (>600M) Mic Betaro 0.11% 0.91 0.00% 0.00% 0.86 (<600M) UpBeta 0.86 Price/Earnings 16.38 25.21 Ratio DownBeta 0.94 Price/BookRatio 1.73 1.52 DownsideStandardDeviation 0.35% DividendYield 2.89% 3.50% SegmentBenchmark NumberOf 452 436 MSCIWorldEx-USALargeCap Holdings Concentration Low Low 21.76% |Vic toryCEMPInternationalVolatilityWtdIndexETF|01Oc tober2016 Page2of3 ©2016,ETF.com Thedataandinformationcontainedhereinisnotintendedtobeinvestmentortaxadvice.Areferencetoaparticularinvestmentorsecurity,a creditrating,oranyobservationconcerningasecurityorinvestmentprovidedintheETF.comServiceisnotarecommendationtobuy,sell,or holdsuchinvestmentorsecurityortomakeanyotherinvestmentdecisions.Youshouldnotusesuchinformationforpurposesofanyactual transactionwithoutconsultinganinvestmentortaxprofessional. ETF.comDOESNOTTAKERESPONSIBILITYFORYOURINVESTMENTOROTHERACTIONSNORSHALLETF.comHAVEANYLIABILITY, CONTINGENTOROTHERWISE,FORTHEACCURACY,COMPLETENESS,TIMELINESS,ORCORRECTSEQUENCINGOFANY INFORMATIONPROVIDEDBYETF.comORFORANYDECISIONMADEORACTIONTAKENBYYOUINRELIANCEUPONSUCH INFORMATIONORETF.com. [ETF.comDOESNOTPROVIDEANYRESEARCHOPINIONS.]ETF.comMAKESNOREPRESENTATIONSABOUTTHESUITABILITYOFTHE INFORMATION,PRODUCTSORSERVICESCONTAINEDHEREIN.PASTPERFORMANCEISNOTINDICATIVEOFFUTURERESULTS. Dataprovider:FactSetResearchSystems,Inc. |Vic toryCEMPInternationalVolatilityWtdIndexETF|01Oc tober2016 Page3of3
