Factors Controlling Pacemaker Action in Cells
of the Sinoatrial Node
By Hsin-Hsiang Lu, M.D., Gertrude Lange, Ph.D., and
Chandler McC. Brooks, Ph.D.
Downloaded from http://circres.ahajournals.org/ by guest on September 30, 2016
• Studies of the effects of imposed drive on
isolated mammalian sinoatrial (SA) node
pacemaker cells were undertaken as a result of
the observed effects of rapid drive imposed on
in situ pacemakers.1 Such studies are not new
since Gaskell in 18842 observed that tetanic
stimulation of the turtle sinus venosus or atria
had an inhibitory effect on pacemaker function. In the most recent studies of the problem
of pacemaker suppression by imposed drive,
intracellular recordings from isolated sinoatrial
node tissues were used. For example, West3
reported that repetitive electrical stimulation
of the SA node is followed by a brief asystole accompanied by membrane hyperpolarization of pacemaker fibers and then by a
period of accelerated firing. The initial negative chronotropic effect is thought to be
due to stimulus-released acetylcholine and
the late acceleration to a release of norepinephrine.4 This explanation of the consequences of imposed drive is supported by
the observations of Hutter and Trautwein,"
Furchgott et al.,° Vincenzi and West4 among
others. It has been amply demonstrated that
acetylcholine depresses the pacemaker potential and that catecholamines accelerate its
rise.7"9
In the work to be reported we determined
quantitatively the after-effects of various rates
and durations of imposed drives, the effects of
liberation of transmitter substances, and the
From the Department of Physiology, Downstate
Medical Center, State University of New York,
Brooklyn, New York.
Supported by a grant from the New York Heart
Association.
Dr. Lu is a Fellow of the China Medical Board of
New York, Inc., from the National Defense Medical
Center, Taipei, Taiwan.
Accepted for publication May 27, 1965.
460
consequences of artificial drive after their
blockade. We also obtained evidence of conduction failures in the SA node and pacemaker
shifts which were of considerable interest. Due
to our previous work, we were able to make
comparisons with imposed drive on in situ
pacemaker tissues.
Methods
SA nodal tissues were obtained from 36 mature cats of either sex. Initially pentobarbital
sodium (40 mg/kg) was employed but better
results were obtained when hearts were removed
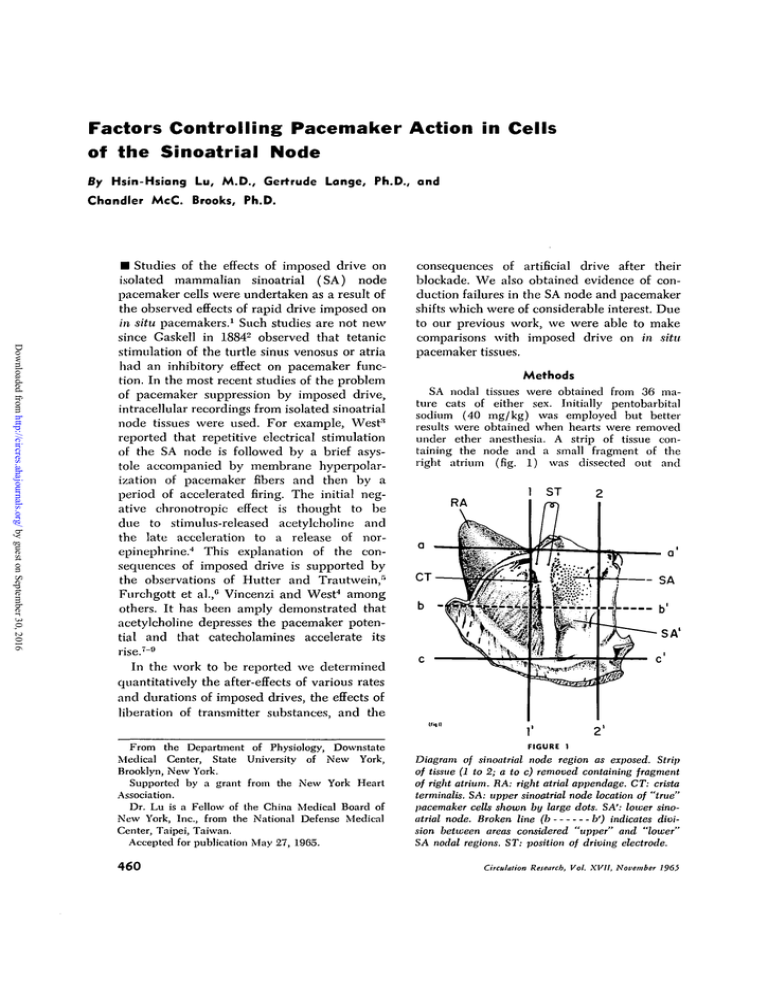
under ether anesthesia. A strip of tissue containing the node and a small fragment of the
right atrium (fig. 1) was dissected out and
1
ST
CT
b
-ii
r
21
FIGURE 1
Diagram of sinoatrial node region as exposed. Strip
of tissue (1 to 2; a to c) removed containing fragment
of right atrium. RA: right atrial appendage. CT: crista
terminalis. SA: upper sinoatrial node location of "true"
pacemaker cells shown by large dots. SA': lower sinoatrial node. Broken line (b
b') indicates division between areas considered "upper" and "lower"
SA nodal regions. ST: position of driving electrode.
Circulation Research, Vol. XVII, November 1965
REACTIONS OF ISOLATED PACEMAKER TISSUE
461
Downloaded from http://circres.ahajournals.org/ by guest on September 30, 2016
fixed in the tissue chamber of a perfusion bath
in a fashion commonly employed for intracellular
recording.10 Temperature was held at 37°C
and a constant perfusion of oxygenated (O 2 ,
95i& and CO2, 5%) Tyrode solution was maintained at a flow rate of 2 ml/min. When drugs
were administered they were dissolved in the
replacing solution or added directly to the tissue
chamber.
Silver bipolar electrodes placed on the surface
of the tissue as shown in figure 1 were used
for stimulation. Stimulating pulses, usually of 1
msec duration, were provided from a Tektronix
unit consisting of a power supply, a waveform
generator, a pulse generator, and were passed
through an isolation unit. Driving stimuli were
applied at intervals varying from 100 msec (rate
of 600/min) to 630 msec (95/min). Drive durations varied between five seconds and five minutes.
Conventional Ling-Gerard microelectrodes were
used for intracellular recording. Changes in membrane potential were monitored through a cath-
ode-follower on a Tektronix 502 dual beam
oscilloscope and photographed by a Grass kymograph camera. Surface recording and intracellular
recording from two adjacent cells were also done
but in most instances single cell responses were
studied, one beam being used to record the entire action potential and the other to monitor the
greatly amplified prepotential changes.
The cells which have the characteristics of
"true" or dominating type of pacemaker cells
were found to be in the upper regions of the
node (fig. 1 SA) while cells in the lower regions
of the node (fig. 1 SA') were "latent" or subsidiary pacemaker cells in that they depolarized more
slowly and their spike potentials rose precipitously
as though a result of propagated excitation. We
found it useful to speak of the upper and lower
SA node regions and the nature of this division
is indicated in figure 1.
When comparisons were made between reactions of upper and lower SA nodal cells, the
tissue strip was cut horizontally as shown (fig.
1 b-b'). Each preparation was allowed to equil-
FIGURE 2
Effects of severing connections between upper and lower SA nodal cells. A: lower nodal cell
activity (upper tracings) before (Al) and after cutting connections (A2). Effects of driving
at rates above the intrinsic (I
I) on upper nodal (lower tracings) and lower nodal cells
(upper tracing of A2). B: lower nodal cells after separation from upper node. Pacemaker action
in lower node was slow, irregular and readily depressed. In B upper tracing is a surface recording. Time 1000 msec; amplification 50 mv.
Circulation Research, Vol. XVII, November
196)
LU, LANGE, BROOKS
462
ibrate for at least one hour in the tissue chamber
before any tests were made. Intrinsic pacemaker
rates were always determined before driving
was attempted and the effects of the driving to
be used were ascertained before drugs were administered. In repetitive testing adequate intervals for recovery were allowed before additional
drives were imposed or drugs given.
In estimating the magnitude of the post-drive
depressions produced, three calculations were
made: time to the first post-drive beat, time required for the first ten or twenty beats, or time
to recovery of a steady state (control rate). Other
details of procedure will be given during description of results obtained.
Downloaded from http://circres.ahajournals.org/ by guest on September 30, 2016
Results
All sinoatrial node preparations containing
upper nodal tissue continued to beat regularly
after removal from the heart when perfused
with warm oxygenated Tyrode solution. None
of the lower SA nodal preparations maintained
an intrinsic rhythm immediately after connec-
tions with upper nodal cells were severed.
Some resumed beating spontaneously after
quiescent periods varying from a few seconds
to several minutes in duration. Others resumed
automaticity only after external stimulation
had been temporarily applied. Four of the five
lower SA nodal tissue fragments studied beat
at a rate significantly slower than did the
upper part of the node and three of the five
showed marked irregularities of rhythm (fig.
2B). Figure 2 (Al and A2) shows the change
produced in one sample experiment following
a dissociation of upper and lower nodal pacemakers by severing connections between them.
As might be expected, cells with different
type action potentials were found in the upper primary pacemaker region. Cells showing a diastolic depolarization (prepotentials)
and repolarization "undershoot" (hyperpolarization) were considered to be pacemaker
AllllllllllllllllllllllllllllilUll
IlilllilillilllllHiilita
.litlijjili!
50 mV C
1000 msec
FIGURE 3
Differences in reactions of SA nodal nonpacemaker (upper tracings) and true pacemaker (lower
tracings) cells at different rates of drive (150/min or 400 msec; 188/min or 320 msec cycle
length) A and B. In C recording is from a Intent or subsidiary pacemaker cell (upper) and true
pacemaker (lower), rate of drive 300/min or 200 msec cycle length. Note the decrease in
amplitude of pacemaker cell spike and the greater than normal duration of pacemaker cell
action potentials after drive. At very high rates only local responses were apparent.
Circulation Research, Vol. XVII, November 1963
REACTIONS OF ISOLATED PACEMAKER TISSUE
463
Downloaded from http://circres.ahajournals.org/ by guest on September 30, 2016
cells but only those with smooth transition
from prepotential to spike potential and a slow
rise time were considered to be true or dominant pacemaker cells. Most of these were located in the upper part of the SA node close
to the endocardial surface and within 1 to 3
mm from the crista terminalis as shown by
Paes de Carvalho et al.10 in the rabbit and by
Miyauchi11 in the dog.
The ability of the various cell types to follow driving stimuli differed. Most preparations could follow a drive of 375 pulses/ min.
True pacemaker cells were less capable of following a fast drive than were nonpacemaker
and latent or subsidiary pacemaker cells. Figure 3 shows that under a fast drive the amplitude of the action potentials of true pacemaker cells declines. The faster the drive the
more rapid the decline. At very fast driving
rates pacemaker cells responded minimally if
at all. During the post-drive period spike amplitudes returned to normal as rate increased.
Another difference shown in figure 3 is
that the durations of pacemaker cell potentials were not reduced as much as were those
of nonpacemaker fibers. The first action potentials recorded in the post-drive period
were actually longer than during the control states.
Pacemaker cells and most latent or subsidiary pacemaker cells showed some degree
of hyperpolarization during imposed drive.
This required three to five seconds to reach
its maximum and it did not increase much
as drive continued. The degree of hyperpolarization increased with rate of drive within limits. Hyperpolarization persisted for only
a few seconds after termination of the drive
and usually disappeared after a few beats
(fig. 4).
It was found in studies of dog hearts in
situ that pacemaker suppression is, within
limits, proportional to rate and to duration of
the drive.1 Figure 5 shows that suppression of pacemaker action increases with duration and also with rate of drive in both
in situ and isolated SA nodal tissue of cats.
Above 50% acceleration of rate, no additional
or even less post-drive depression occurs.
Whatever the depressing influence may be,
there is an optimum rate of drive for its accumulation. Figure 6 gives the data obtained
in 398 tests on 34 preparations in which the
relation of percentage increase in drive rate to
extent of post-drive depression was deter-
i-U-LLLLLLLUi
-\rVVVWVWVVV\j
LLLLLLLLLLLLL
IOOO msec
FIGURE 4
Effects of driving a sinoatrial nodal cell at a uniform fast rate (300/min or cycle length 200
msec) for five seconds (upper records) and ten seconds (lower records). Upper tracings are of
same cell as in lower but at a higher amplification. Note hyperpolarization time courses and
slightly longer post-drive depression after longer drive.
Circulation Reiearch, Vol. XVII, November
196)
464
LU, LANGE, BROOKS
ISOLATED TISSUE
IN SITU TISSUE
CO
60
LJ
Q UJ
°
40
Downloaded from http://circres.ahajournals.org/ by guest on September 30, 2016
si
20
o:
x
UJ
(tig 5)
10
I
I
20
30
40
I
I
50
60
70
% INCREASE IN RATE OF DRIVE
FIGURE 5
Comparison of depression in isolated (
) and in in situ (-) SA nodal tissue
of cats after drives of five and thirty seconds at rates of increasing percentage above control
intrinsic rates. Per cent depression is per cent over time required for 20 beats at the control rate.
mined. It can be seen in B that at rates of
drive only slightly above normal, acceleration
rather than depression frequently occurs. Figure 7 illustrates the increase of depression observed when drive is prolonged but this
applies only up to a limit. In the experiment
shown, acceleration rather than depression
dominated after a drive of five minutes. This
will be discussed later.
In production of post-drive depression the
interval between beats is important. When a
drive was imposed for 10 seconds, and when
an interval of 400 msec was maintained between driving stimuli, the time required for
ten post-drive beats increased by 25%. When
the same number of stimuli were given in five
seconds (200 msec intervals between stimuli)
a greater post-drive depression resulted. Thus,
the time to first beat increased by 120% and
the time required for the first ten beats increased to 151% above the control values.
Figure 8 shows superimposed action potentials from a pacemaker cell. It can be
seen that the rise time of the prepotential
and the time to spike generation is greatly
prolonged after drive. It also shows a reduction in amplitude of the intrinsic pacemaker potential. The spike generated in the
first and third post-drive response propagated apparently from a different cell; the initial
hump in the first tracing was probably the
cell's local response. Figure 9A shows an example of post-drive depression of the pacemaker potential, but in this case it was. able to
fire the cell. In subsequent beats this prepotential augmented gradually to normal
amplitude. In some instances depression of
pacemaker action in a cell by rapid drive reCirctilation Research, Vol. XVII. November
REACTIONS OF ISOLATED PACEMAKER TISSUE
suited in permanent loss of dominance. As
shown in figure 9B, although this dominant
pacemaker cell's prepotential recovered progressively, it did not generate an action potential but firing was triggered from an adjacent
cell. Eventually dominance by the initial pacemaker cell was restored.
Following rapid stimulation of SA nodal
tissue, subthreshold oscillations of the resting
potential occur (fig. 9C). It was found that
the suppressing effect of rapid drive acted not
only by reducing the amplitude of the preDownloaded from http://circres.ahajournals.org/ by guest on September 30, 2016
200
UJ
m
150
I
4.!
100
V) UJ
O </5
Q. <
. y
so
0-20
20.1-40
40.1-60 60.1-80 80.1-100
% INCREASE IN RATE OF DRIVE
UJ
CD
400
a.
•
o UJ
300
200
a. u.
o o
100
0-120 20.1-40 40.1-60 601-80 80.1-100
K
% INCREASE IN RATE OF DRIVE
FIGURE 6
Increase in post-drive depression with rates of drive at
various percentages over the basal intrinsic rate. Time
to first beat (A) and time required for first ten beats
(B) expressed in percentage prolongation above normal. Standard error given; data from 34 preparations.
Circulation Research, Vol. XVII, November 1965
465
potential to ineffective values but also by
reducing the rate of occurrence below that of
the predrive state. This phenomenon appeared
more frequently and persisted longer after an
anticholinesterase was given. Epinephrine
tended to hasten the return of these subthreshold potentials to normal intensity and restored
a normal firing pattern more quickly.
In figure 9C, which shows action potentials from the same pacemaker cell at different amplifications, it can be seen that
oscillations sometimes occur from a basic
potential level somewhat lower than control
values as though the membrane were unable
either to initiate and propagate an action
potential or repolarize to normal levels. It
seems also that the threshold for initiation
of a regenerative or propagated response
had been raised (fig. 9C and D). Recovery
in these instances involved return to a normal base line, growth of the local response
to normal amplitude, a lowering to normal of
the threshold for spike generation, and a regaining of dominance by this pacemaker cell.
The first four post-drive propagated potentials
of figure 9C obviously originated in a neighboring pacemaker, propagating with some
decrement. Figure 9D shows the change in
base line and thresholds for propagation but
only one local response. Here, too, the initial
action potentials were of ectopic origin indicating slower recovery of domination by this
pacemaker cell.
One of the most interesting findings of
this work was the conduction block which
occurs within the node. This phenomenon
requires more study but multiple recordings
showed that even under "normal" conditions block of propagation occurs between
cells. After rapid driving this tendency for
block to develop is augmented. Figure 10
shows a true pacemaker cell driving an adjacent subsidiary pacemaker cell. After a
period of rapid drive, slow local responses
occurred only in this pacemaker but periodically a distant pacemaker triggered a response in it. This action potential, however,
did not propagate to the latent or subsidiary
LU, LANGE, BROOKS
466
Downloaded from http://circres.ahajournals.org/ by guest on September 30, 2016
10
(tig.7)
20
30
40
50
DURATION OF DRIVE
60
(sec )
300
FIGURE 7
Augmentation of depression, expressed in percentage increase of time to first beat and of time
for first ten beats, as affected by prolonging the duration of drive. Note that acceleration occurred after five minute drive.
Control
20 th.
3rd.
1st.
5mV
i i
"•"'
100 msec
FIGURE 8
Superimposed action potentials showing rise time and
amplitude of prepotential at time of spike generation.
See text.
cell. As recovery proceeded the impulse from
the new ectopic pacemaker regularly reached
the pacemaker and occasionally fired the second cell. As the original pacemaker regained
control, conduction block also disappeared.
It is the opinion of pharmacologists4' °' 9 ' ithat the suppression following drive is due,
at least in part, to release of acetylcholine.
Our results are in agreement with this because addition of Prostigmin to the perfusion bath augmented post-drive depression,
increased hyperpolarization during drive and
fostered conduction block. Atropine counteracted the depression (fig. 11). When atropine
alone was given it reduced but did not abolish
post-drive depression and, therefore, it was
concluded that factors other than acetylcholine
release and accumulation are involved.
One obviously possible effect of rapid
drive is a change in membrane permeability
to potassium, in durations of K+ ion flux
and in potassium gradients. This matter requires more study but increasing external potassium concentration by 50 to 100% reduced
post-drive depression.
Circulation Research, Vol. XV11, November
196}
467
REACTIONS OF ISOLATED PACEMAKER TISSUE
We found as did West3 that post-drive
depression ended in an overshoot or supernormal acceleration of pacemaker action.
The latency, amplitude, and duration of this
acceleration depended upon rate and duration of the drive. Faster rates of drive produced greater immediate depressions but also higher and longer lasting accelerations
above control rates. The duration of depression was frequently shortened by the
augmentation of acceleratory influences due
to faster driving. Longer durations of drive
augmented late acceleration as they did the
early depression of pacemaker action. In
some preparations the acceleratory post-drive
effects outweighed depressor actions and, in
these, longer duration of drive gave earlier,
greater, and longer lasting accelerations up to
a limit. Figure 12 illustrates this point, showing that after the longest drive both inhibition-producing and acceleration-producing influences were maximal. It has already been
shown in figure 7 that driving at rates only
slightly faster than normal (less than 20%
faster) tends to cause acceleration and little or
no preceding depression. It was also shown in
Downloaded from http://circres.ahajournals.org/ by guest on September 30, 2016
5 mv c r
50 mV [ i
1000 msec
FIGURE 9
A: depression of pacemaker potential by rapid drive and its post-drive recovery without loss
of pacemaker action. B: depression of pacemaker potential with loss of dominance. C: local
responses of subnormal frequency and a temporarily maintained post-drive hypopolarization
and increase in threshold potential (C and D). See text.
FIGURE 10
Record of activity in a pacemaker cell (lower tracing) which, before imposed drive, initiated
firing of an adjacent cell (upper tracing). Failure of local responses to evoke action potentials
is shown. Action potentials originating in ectopic pacemakers failed, following drive, to propagate from one cell (original pacemaker) to its original subsidiary cell. See text.
Circulation Research, Vol. XVII, November 196)
LU, LANGE, BROOKS
468
figure 5 that, after long periods of driving,
accelerator influences may predominate. As
might be expected, cocaine augments acceleration effects and reserpine diminishes them.
Discussion
Downloaded from http://circres.ahajournals.org/ by guest on September 30, 2016
This work lends support to the hypothesis that rapid driving of pacemaker cells by
imposed or intrinsic drive tends to inhibit
their pacemaker actions;1-2-9 lower SA nodal
cells have a slower and more irregular rate
of firing than do upper SA nodal fibers
and they are more readily depressed by
drive above their intrinsic rates of firing.1
The sinoatrial node contains true pacemaker
fibers, latent or subsidiary pacemaker cells,
and cells which show little or no prepotential. Even under relatively normal conditions
the site of origin of beats may shift somewhat within the node.13'14 It is of interest
that true pacemaker cells can be driven less
rapidly than can the other types of nodal
cell15 and that they recover from post-drive
depression less rapidly. Thus, after drive, a
shift of pacemaker is usually observed. Cells
other than those from which recordings were
made tended to initiate the first post-drive
propagated responses. This slowness of response and recovery characterizes nodal cells
of the pacemaker category.10
Certainly, electrical stimuli cause discharge
of an admixture of acetylcholine and nor-
FlSORE TT
Influence of Prostigmin and atropine on effects of extrinsic driving of pacemaker tissue. A: control drive effects; B: effects of drive fifteen minutes and C: thirty minutes after adding Prostigmin (1:2,000,000 cone in perfusion fluid). D: return toward control-type reaction after atropine
(1:2,000,000 cone).
Circulation Research, Vol. XVII, November 1965
469
REACTIONS OF ISOLATED PACEMAKER TISSUE
240
220 -
200-
180 -
160 Downloaded from http://circres.ahajournals.org/ by guest on September 30, 2016
LU
120-
DURATION OF DRIVE
100 i \
80 -
I
•"
!
|
I!
60-
!!
I!
I!
y
40
(fi
9'2'
I
2
4
6
TIME AFTER DRIVE
8
(second)
-1—if—/ /
10
30 60
FIGURE 12
Changes in post-drive depression and acceleration as produced by driving at uniform rates
for various periods of time. See text.
epinephrine from nerve endings and tissue
stores. 4 0 0 The fact that post-drive depression is reduced but not abolished by atropine suggests that the effects may be, in
part, the consequence of ion shifts and
changes in membrane permeability not fully
dependent on acetylcholine release. Acetylcholine is thought to act by increasing membrane permeability to potassium.12- "• 1 8 The
hyperpolarization during drive could be due
to augmented K* efflux;9'12 the slower rise
and lower amplitude of the pacemaker potenCirculation Research, Vol. XVII, November 1965
tial and the occurrence of small local potentials after drive3 could be due to increased
extracellular potassium or potassium efflux
such as occurs during acetylcholine action and
even in its absence. The post-drive rise in
base line observed in sinus cells could indicate an abnormal potassium transmembrane
balance.3'10 Even the acceleration following
minimal rates of drive might be influenced
by a K* ion shift as well as by catecholamine release. It has been stated that the
spontaneous rhythmicity of sinus fibers is
470
LU, LANGE, BROOKS
Downloaded from http://circres.ahajournals.org/ by guest on September 30, 2016
enhanced by an extracellular potassium concentration sufficiently above normal to cause
partial depolarization of the cell.19
The presence of acetylcholine and an excess of extracellular potassium might also
explain the failure of conduction within the
sinoatrial node following rapid drive. Studies of conduction within the atrioventricular node10'1(i revealed the marginal nature
of the factor of safety for conduction in such
tissue. It is not surprising to observe block
and decrementing propagation in the sinoatrial node. Post-drive depression might be
due, in part, to failure of conduction of activity from pacemaker cells as well as to
suppression of activity within the pacemakers.
The occurrence of both has been demonstrated
in this work.
Our studies confirmed the work of West
and others4'c-" who obtained evidence that
catecholamine release occurs during drive
of pacemaker tissues. We found that in certain preparations the post-drive acceleration
response was more predominant than in
others; it, like the depressor influences,
showed a quantitative relationship to the rate
and duration of imposed drive. Responses
of isolated and in situ pacemaker cells to
drive are much the same.1
Summary
Rapid drive of isolated pacemaker tissues
from cats resulted in a post-drive depression
followed by a late acceleration to supernormal rates of pacemaker activity. These
effects were similar to those occurring after
drive of the pacemaker in situ. Lower SA
nodal pacemakers discharged more slowly
and irregularly than did upper SA nodal
pacemaker cells. They were more readily depressed by rapid imposed drive. The balance between depression and acceleration
varied in different preparations. Drive at
only slightly above the intrinsic rate resulted frequently in acceleration not preceded by depression. Within limits, the
greater the frequency and duration of drive,
the greater the intensity and duration of
both the depression and the late acceleration.
Prostigmin augmented and atropine reduced
post-drive depression. Cocaine potentiated the
late acceleration. Excess potassium reduced
post-drive depression and, in concentrations
used, caused some acceleration.
Pacemaker cells could be driven less rapidly
than could other SA nodal cells. Drive generally shifted pacemaker action to a distant
site; the first post-drive propagated responses
originated from other pacemaker cells and
dominance by the original unit was reestablished slowly. Rapid drive reduced amplitudes
of action potentials and prepotentials. It also
raised threshold potentials and during the
post-drive period the durations of pacemaker
cell action potentials were temporarily prolonged. In some preparations membrane potentials remained at a subnormal value after
drive. Subthreshold potentials occurred at a
somewhat subnormal rhythm but gradually
developed an effective amplitude.
Conduction block was observed in isolated SA nodal tissue. This was augmented
during the post-drive period of depression.
This work lends support to the hypothesis1 that dominating action by pacemaker
cells influences the pacemaker activity in
other potential pacemaker tissues.
References
1. LANCE, C : The action of driving stimuli from
intrinsic and extrinsic sources on in situ
cardiac pacemaker tissues. Circulation Res.
17: 449, 1965.
2.
CASKELL,
W. H.:
On
the innervation
of
the
heart with especial reference to the heart of
the tortoise. J. Physiol. 4: 43, 1884.
3. WEST, T. C : Effects of chronotropic influences
on subthreshold oscillations in the sino-atrial
node. In The Specialized Tissues of the Heart,
ed. by A. Paes de Carvalho, W. C. de Mello,
and B. F. Hoffman. Amsterdam, Elsevier
Publishing Company, 1961, pp. 81-94.
4.
VINCENZJ, F. F., AND WEST, T. C : Release of
autonomic mediators in cardiac tissue by direct
subthreshold electrical stimulation. J. Pharmacol. Exptl. Therap. 141: 185, 1963.
5.
HUTTEB, O. F., AND TRAUTWEIN, W.: Vagal and
sympathetic effects on the pacemaker fibers
in the sinus venosus of the heart. J. Gen.
Physiol. 39: 715, 1956.
6.
FURCHGOTT, R. F . , DE GuBAREFF, T., AND G R O S S -
MAN, A.: Release of autonomic mediators in
cardiac tissue by suprathreshold stimulation.
Science 129: 328, 1959.
Circulation Research, Vol. XVH, November 1965
471
REACTIONS OF ISOLATED PACEMAKER TISSUE
impulse in the heart. Am. J. Physiol. 34: 368,
1914.
7. WEST, T. C , FALK, C , AND CERVONI, P.: Drug
alteration of transmenibrane potentials in atrial
pacemaker cells. J. Pharmacol. Exptl. Therap.
117: 245, 1956.
14.
the heart beat. I. Location, action potential
and electric excitability of the pacemaker.
Proc. Roy. Soc, London, Ser. B. 115: 307,
1934.
8. TRAUTWEIN, W., AND DUDEL, J.: Hemmende und
"erregende" Wirkungen des Acetylcholin am
Warmbliiterherzen. Zur Frage der spontanen
Erregungsbildung. Pfliigers Arch. ges. Physiol.
266: 653, 1958.
15. CERVONI, P., WEST, T. C , AND FALK, C : Multi-
ple intracellular recording from atrial and sinoatrial cells: Correlation with contractile tension. Proc. Soc. Exptl. Biol. Med. 93: 36, 1956.
9. AMORY, D. W., AND WEST, T. C : Chronotropic
response following direct electrical stimulation
of the isolated sinoatrial node: A pharmacological evaluation. J. Pharmacol. Exptl. Therap.
137: 14, 1962.
10. PAES DE CARVALHO, A., DE MELLO, W. C , AND
HOFFMAN, B. F.: Electrophysiological evi-
Downloaded from http://circres.ahajournals.org/ by guest on September 30, 2016
dence for specialized fiber types in rabbit
atrium. Am. T. Physiol. 196: 483, 1959.
11. MiYAUCHr, A.: Electrical events in specialized
muscle fibers of a mammalian right atrium.
S-A node. Japan. Heart J. 3; part 1: 357, 1962.
ECCLES, J. C , AND HOFF, H. H.: The rhythm of
16.
HOFFMAN, B. F., AND CRANEFIELD, P. F.: Elec-
trophysiology of the Heart. New York,
McGraw-Hill Book Company Inc., 1960, pp.
112-290.
17. TRAUTWEIN, W., KUFFLER, S. W., AND EDWARDS,
C : Changes in membrane characteristics of
heart muscle during inhibition. J. Gen. Physiol.
40: 135, 1956.
18. TRAUTWEIN, W., AND DUDEL, J.: Zum Mechanis-
12. TRAUTWEIN, W.: Generation and conduction of
mus der Herzmuskelfaser. Pfliigers Arch. ges.
Physiol. 266: 324, 1958.
impulses in the heart as affected by drugs.
Pharmacol. Rev. 15: 277, 1963.
19. BROOKS, C. M C C , HOFFMAN, B. F., SUCKLING,
E. E., AND OBIAS, O.: Excitability of the
13. MEEK, W. J., AND EYSTER, J. A. E.: Experi-
Heart. New York, Grune and Stratton Inc.,
1960, p. 290.
ments on the origin and propagation of the
Circulation Research, Vol. XV11, November 196}
Factors Controlling Pacemaker Action in Cells of the Sinoatrial Node
HSIN-HSIANG LU, GERTRUDE LANGE and CHANDLER McC. BROOKS
Downloaded from http://circres.ahajournals.org/ by guest on September 30, 2016
Circ Res. 1965;17:460-471
doi: 10.1161/01.RES.17.5.460
Circulation Research is published by the American Heart Association, 7272 Greenville Avenue, Dallas, TX 75231
Copyright © 1965 American Heart Association, Inc. All rights reserved.
Print ISSN: 0009-7330. Online ISSN: 1524-4571
The online version of this article, along with updated information and services, is located on the
World Wide Web at:
http://circres.ahajournals.org/content/17/5/460
Permissions: Requests for permissions to reproduce figures, tables, or portions of articles originally published in
Circulation Research can be obtained via RightsLink, a service of the Copyright Clearance Center, not the
Editorial Office. Once the online version of the published article for which permission is being requested is
located, click Request Permissions in the middle column of the Web page under Services. Further information
about this process is available in the Permissions and Rights Question and Answer document.
Reprints: Information about reprints can be found online at:
http://www.lww.com/reprints
Subscriptions: Information about subscribing to Circulation Research is online at:
http://circres.ahajournals.org//subscriptions/

