Misfire Detection in a Spark Ignition Engine using Support Vector
advertisement

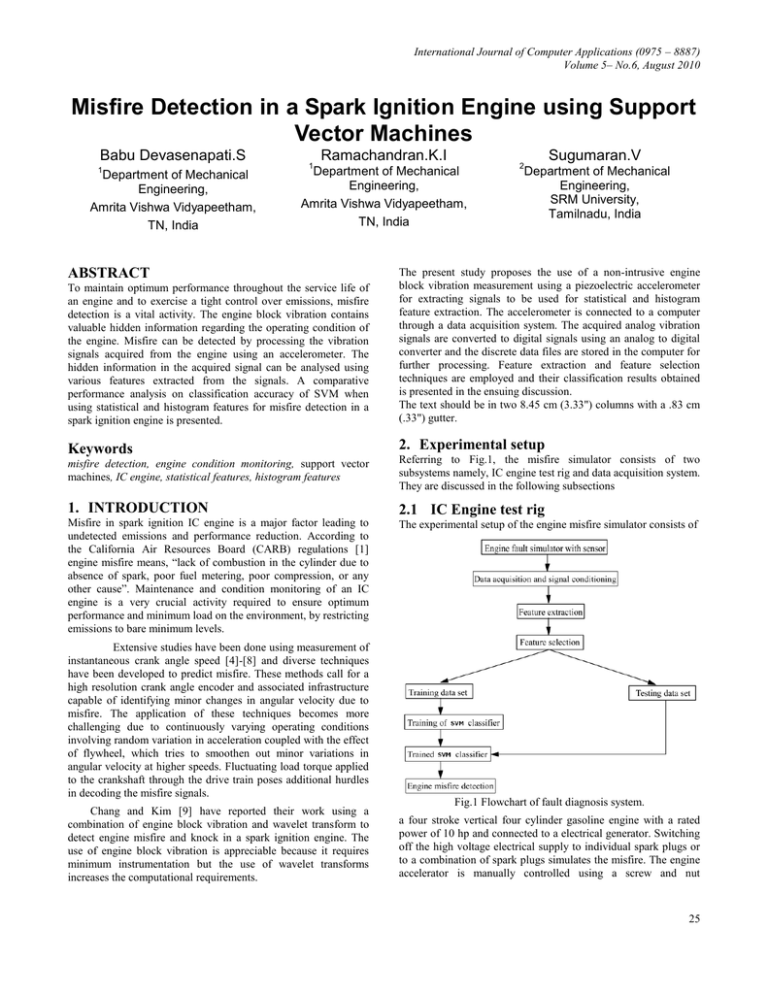
International Journal of Computer Applications (0975 – 8887) Volume 5– No.6, August 2010 Misfire Detection in a Spark Ignition Engine using Support Vector Machines Babu Devasenapati.S 1 Department of Mechanical Engineering, Amrita Vishwa Vidyapeetham, TN, India 1 Ramachandran.K.I Department of Mechanical Engineering, Amrita Vishwa Vidyapeetham, TN, India ABSTRACT 2 Sugumaran.V Department of Mechanical Engineering, SRM University, Tamilnadu, India To maintain optimum performance throughout the service life of an engine and to exercise a tight control over emissions, misfire detection is a vital activity. The engine block vibration contains valuable hidden information regarding the operating condition of the engine. Misfire can be detected by processing the vibration signals acquired from the engine using an accelerometer. The hidden information in the acquired signal can be analysed using various features extracted from the signals. A comparative performance analysis on classification accuracy of SVM when using statistical and histogram features for misfire detection in a spark ignition engine is presented. The present study proposes the use of a non-intrusive engine block vibration measurement using a piezoelectric accelerometer for extracting signals to be used for statistical and histogram feature extraction. The accelerometer is connected to a computer through a data acquisition system. The acquired analog vibration signals are converted to digital signals using an analog to digital converter and the discrete data files are stored in the computer for further processing. Feature extraction and feature selection techniques are employed and their classification results obtained is presented in the ensuing discussion. The text should be in two 8.45 cm (3.33") columns with a .83 cm (.33") gutter. Keywords 2. Experimental setup misfire detection, engine condition monitoring, support vector machines, IC engine, statistical features, histogram features Referring to Fig.1, the misfire simulator consists of two subsystems namely, IC engine test rig and data acquisition system. They are discussed in the following subsections 1. INTRODUCTION 2.1 IC Engine test rig Misfire in spark ignition IC engine is a major factor leading to undetected emissions and performance reduction. According to the California Air Resources Board (CARB) regulations [1] engine misfire means, “lack of combustion in the cylinder due to absence of spark, poor fuel metering, poor compression, or any other cause”. Maintenance and condition monitoring of an IC engine is a very crucial activity required to ensure optimum performance and minimum load on the environment, by restricting emissions to bare minimum levels. The experimental setup of the engine misfire simulator consists of Extensive studies have been done using measurement of instantaneous crank angle speed [4]-[8] and diverse techniques have been developed to predict misfire. These methods call for a high resolution crank angle encoder and associated infrastructure capable of identifying minor changes in angular velocity due to misfire. The application of these techniques becomes more challenging due to continuously varying operating conditions involving random variation in acceleration coupled with the effect of flywheel, which tries to smoothen out minor variations in angular velocity at higher speeds. Fluctuating load torque applied to the crankshaft through the drive train poses additional hurdles in decoding the misfire signals. Chang and Kim [9] have reported their work using a combination of engine block vibration and wavelet transform to detect engine misfire and knock in a spark ignition engine. The use of engine block vibration is appreciable because it requires minimum instrumentation but the use of wavelet transforms increases the computational requirements. Fig.1 Flowchart of fault diagnosis system. a four stroke vertical four cylinder gasoline engine with a rated power of 10 hp and connected to a electrical generator. Switching off the high voltage electrical supply to individual spark plugs or to a combination of spark plugs simulates the misfire. The engine accelerator is manually controlled using a screw and nut 25 mechanism that can be locked in any desired position. The engine speed is monitored using an optical interference tachometer. 2.2 Data acquisition system Accelerometers have a wide operating range enabling them to detect very small and large vibrations. The vibration sensed is a reflection of the internal engine condition. The voltage output of the accelerometers is directly proportional to the vibration. A piezoelectric accelerometer and its accessories form the core equipment for vibration measurement and recording. Amplitude (Cylinder 1 Misfire) International Journal of Computer Applications (0975 – 8887) Volume 5– No.6, August 2010 3 2 1 0 -1 0 2000 4000 6000 8000 Sample Number Fig.2 Schematic of experimental setup As represented in Fig 2 the accelerometer is directly mounted on the center of the engine block using adhesive mounting. The output of the accelerometer is connected to the signalconditioning unit, a FFT analyzer that converts the signal from Analogue to Digital (ADC). The digitized vibration signal (in time domain) is given as input to the computer through the USB port. The data is stored in the secondary memory of the computer using the accompanying software for data processing and feature extraction. 3. Experimental procedure The engine is started by electrical cranking at no load and warmed up for 15 minutes. The FFT analyzer is switched on, the accelerometer is initialized and the data is recorded after the engine speed gets stabilized. A sampling frequency of 24 kHz and sample length of 8192 is maintained for all conditions. The highest frequency was found to be 10 kHz and since Nyquist sampling theorem says that the sampling frequency must be at least twice that of the highest measured frequency or higher. Hence the sampling frequency was chosen to be 24kHz. Extensive trials were taken at 1500 rpm and discrete vibration signals were stored in the files. Five cases were considered normal running (without any fault), engine with any one-cylinder misfire individually (i.e. first, second, third or fourth). All the misfire events were simulated at 1500 rpm, the rated speed of the engine electrical generator set. Time domain plots of the representative signals at 1500 rpm are shown in Fig.3a and Fig.3b Amplitude (No Misfire) Fig.3a Amplitude plot - cylinder 1 misfire 3 2 1 0 -1 0 2000 4000 6000 8000 Sample Number Fig.3b Amplitude plot – No misfire 4. Feature extraction Referring to Fig.1, after data acquisition, the next step is feature extraction. The process of computing relevant parameters of the signals that reveal the information contained in the signal is called feature extraction. The two different sets of features are extracted namely statistical features and histogram features. Statistical analysis of vibration signals yields different parameters. The parameters taken for this study are mean, standard error, median, standard deviation, sample variance, kurtosis, skewness, range, minimum, maximum and sum. Histogram can be drawn for each signal. It has different values for different classes. The total range of amplitude of vibration is divided in to 20 sub ranges namely‟f1‟,‟f2‟,….‟f20‟. Histogram is plotted with these sub ranges as bin. The height of the histogram which is a count of number of data points falling within a sub range, becomes the value of the features „f1‟, „f2‟, etc., These features are defined as histogram features and can be used to detect misfire. These features were extracted from the vibration signals. All these features may not be required to capture the information required for classification. The relevant ones can be selected by several means. This work focuses on the use of SVM for feature reduction and feature classification. 5. Support Vector Machines (SVM) SVM belongs to the class of supervised learning algorithms in which the learning machine is given a set of features (or inputs) with the associated labels (or output values). Each of these features can be looked upon as a dimension of a hyper plane. 26 International Journal of Computer Applications (0975 – 8887) Volume 5– No.6, August 2010 SVM‟s construct a hyper plane that separates the hyperspace into two classes, this can be extended to multi class problems . While doing so, the SVM algorithm tries to achieve maximum separation between the classes (See Fig.4). Separating the classes with a large margin minimizes the expected generalization error. By „minimum generalization error‟, it is meant that when a new set of features (that is data points with unknown class values) arrive for classification, the chance of making an error in the prediction (of the class to which it belongs) based on the learned classifier (hyper plane) should be minimum. Intuitively, such a classifier is one, which achieves maximum separation-margin between the classes. The above process of maximizing separation leads to two hyper planes parallel to the separating plane, on either side of it. These two can have one or more points on them. The planes are known as ‘bounding planes’ and the distance between them is called as ‘margin’. By SVM „learning‟, we mean, finding a hyper plane, which maximizes the margin and minimizes the misclassification error. The points lying beyond the bounding planes are called support vectors. The data points P1, P2, P3, P4, and P5 belonging to A- are support vectors (See Fig.4), but P6, P7 are not. Same facts hold good for class A+. These points play a crucial role in the theory and hence the name ‘Support Vector Machines’. Here, by „machine‟, we mean an algorithm. In the formulation, „A‟ is an m by n matrix whose elements belong to real space, „D‟ is an m by 1 matrix representing class label (+1 and –1); „e‟ is a vector of ones and „‟ is a control parameter that defines the weight of error minimization and bounding plane separation in the objective function. „w‟ is orientation parameter and „‟ is location parameter (location relative to origin) of separating hyper plane. With these notations, 1 min e' y w' w 2 w, , y R n 1 m Subjected to (1) y0 m1 Where, 6. Results and discussion The study of misfire classification using SVM is discussed in the following phases 1. Dimensionality reduction (Feature selection) 2. Evaluation of the classifier From the experimental setup through data acquisition 200 signals have been acquired for each condition. The conditions are mentioned in section 3. Out of these 200 signals, 100 signals were kept aside for testing purpose and the remaining 100 signals were used for building the classifier. 6.1 Dimensionality reduction D( Aw e ) y e A R mn , D 1,1 Fig. 4. Standard SVM classifier , e 1m1 If the training features are separated without errors by an optimal hyper-plane, the expected error rate on a test sample is bounded by the ratio of the expectation of the support vectors to the number of training vectors. The smaller the size of the support vector set, more general the above result. Further, the generalization is independent of the dimension of the problem. In case such a hyper-plane is not possible, the next best is to minimize the number of misclassifications whilst maximizing the margin with respect to the correctly classified features. Dimensionality reduction is the process of reducing the number of input features that are required for classification, done with the main intention of reducing the computational effort. From the signals obtained at 1500 rpm, 20 histogram features and 11 statistical features were extracted. All these features were given as input to the SVM algorithm and the corresponding relative importance of variable for classification is evaluated independently for both statistical and histogram features. The results are presented as a bar chart in Fig.5 and Fig 6. The bar chart gives an estimate of the worth of a feature representing them in the order of relative weightage. The feature with high relative weightage contains maximum information about the signal and the remaining features in the chart contain information proportional to their relative weightage. The missing features do not have significant information for classification; however they are considered randomly to complete the list in the study of the effect of dimension to the classification accuracy. Seven histogram features namely f5, f3, f13, f9, f10, f18 and f8 are identified as prominent features based on their relative weightage and were used for further processing. Similarly eight statistical features namely skewness, standard error, standard deviation, standard variance, maximum, kurtosis, median and range were used for further processing. Including all the features may improve the classification accuracy marginally; however there is a risk of over fitting the data. After dimensionality 27 International Journal of Computer Applications (0975 – 8887) Volume 5– No.6, August 2010 reduction the reduced data set is used for training and evaluating the network. Table 1 Confusion matrix for statistical features – Testing phase Table 2 Confusion matrix for histogram features - Testing phase Fig 5 Relative importance of variable for classification using histogram feature Observing the results presented in Table 3, it is evident that the overall performance of SVM for misfire detection is very encouraging. Comparing the performance of the SVM classifier with two different set of features namely statistical features and histogram features, it is observed that histogram features deliver better results than statistical features. It may be concluded that a combination of histogram features and SVM perform appreciably well for misfire detection. A lower margin between the classification accuracies obtained during the training and testing phase implies that data over fitting error is reduced to a minimum and the classifier performs appreciably well when exposed to unseen data in both the cases. Fig 6 Relative importance of variable for classification using statistical feature Table 3 Comparison of classifier performance 6.2 Evaluation of classifier Evaluation of the classifier is performed using the 100 data points, which were kept aside for testing. The classifier performance in detecting engine misfire using statistical features and histogram feature were evaluated separately and the results are presented below in the form of confusion matrices. The misclassification details obtained using statistical features are presented in the form of a confusion matrix in Table 1a and Table 1b. C1m represents misfire in cylinder 1, c2m, c3m, c4m represents misfire in cylinder 2, 3, and 4 respectively. Good represents no misfire in any cylinder. The diagonal elements shown in the confusion matrix represents the correctly classified points and non-diagonal elements are misclassified ones. Referring to Table 1, it is evident that the misclassification among the faulty conditions and „good‟ condition is nil. However there are minor misclassifications among the faulty conditions. In a condition monitoring activity fault identification forms the major objective and fault classification comes second in priority. In this context, the present algorithm (SVM) performs fault identification (differentiating between good and faulty conditions) sufficiently well (100%). A similar observation can be made for Table 2. 7. Conclusion A rapid growth in the use of automobiles the world over and the associated environmental impact has induced lot of thrust on misfire detection in IC engines and hence taken up for study. The search for an effective classifier to do this resulted in the use of SVM algorithm. In any fault classification study using pattern recognition techniques, feature selection and feature classification has to be carried out after extracting the relevant features from the vibration signals. SVM algorithm has the distinction of performing these two activities simultaneously with reasonably less computational effort. The results presented in section 6 illustrate these capabilities. The classification accuracy on unseen data when using histogram features is found to be around 98.4%. From the results presented it is encouraging to conclude that the combination of histogram features and SVM algorithm is well suited for detection of misfire in IC engines. 28 International Journal of Computer Applications (0975 – 8887) Volume 5– No.6, August 2010 REFERENCE 1. California Air Resources Board (1991), Technical status Update and Proposed Revisions to Malfunction and Diagnostic System Requirements Applicable to 1994 and Subsequent California Passenger Cars, Light-Duty Trucks, and Medium-Duty Vehicles – (OBDII), CARB staff report. 2. Lee, D., and Rizzoni, G., Detection of Partial Misfire in IC Engines Using Measurement of Crankshaft Angular Velocity, SAE Paper 951070, 1995. 3. Klenk, M., Moser, W., Mueller, W., and Wimmer, W., Misfire Detection by Evaluating Crankshaft Speed – A Means to Comply with OBDII, SAE Paper 93099, 1993. 4. Francisco V. Tinaut, Andres Melgar, Hannes Laget, Jose I. Dominguez, Misfire and compression fault detection through the energy model, Mechanical Systems and Signal ProcessingVolume 21, Issue 3, (2007) 1521-1535 5. Andrew W. Osburn, Theodore M. Kostek, Matthew A. Franchek, Residual generation and statistical pattern recognition for engine misfire diagnostics, Mechanical Systems and Signal Processing, Volume 20, Issue 8, (2006) 2232-2258. 6. Kuroda, Y. Shimasaki, H. Igarashi, S. Maruyama, T. Asaka, Development on digital filtering technology of crank speed measurement to detect misfire in internal combustion engine at high speed revolution, JSAE ReviewVolume 16, Issue 4, (1995) 387-390. 7. Cavina and F. Ponti, Engine Torque Nonuniformity Evaluation Using Instantaneous Crankshaft Speed Signal, Journal of Engineering for Gas Turbines and Power, Volume 125, Issue 4, (2003) 1050-1058. 8. Bo-Chiuan Chen - ,Yuh-Yih Wu - Feng-Chi Hsieh, Go-Long Tsai, Crank Angle Estimation with Kalman Filter and Stroke Identification for Electronic Fuel Injection Control of a Scooter Engine, SAE Document Number: 2005-01-0076, 2005. 9. Detection of misfire and knock in spark ignition engines by wavelet transform of engine block vibration signals CHANG Jinseok, KIM Manshik, MIN Kyoungdoug, Measurement science & technology, vol. 13, Issue 7, (2002) 1108-1114 29


