Page 225 - ClassZone
s8pe-20704-ca 12/19/05 4:44 PM Page 225 MAZER PDF
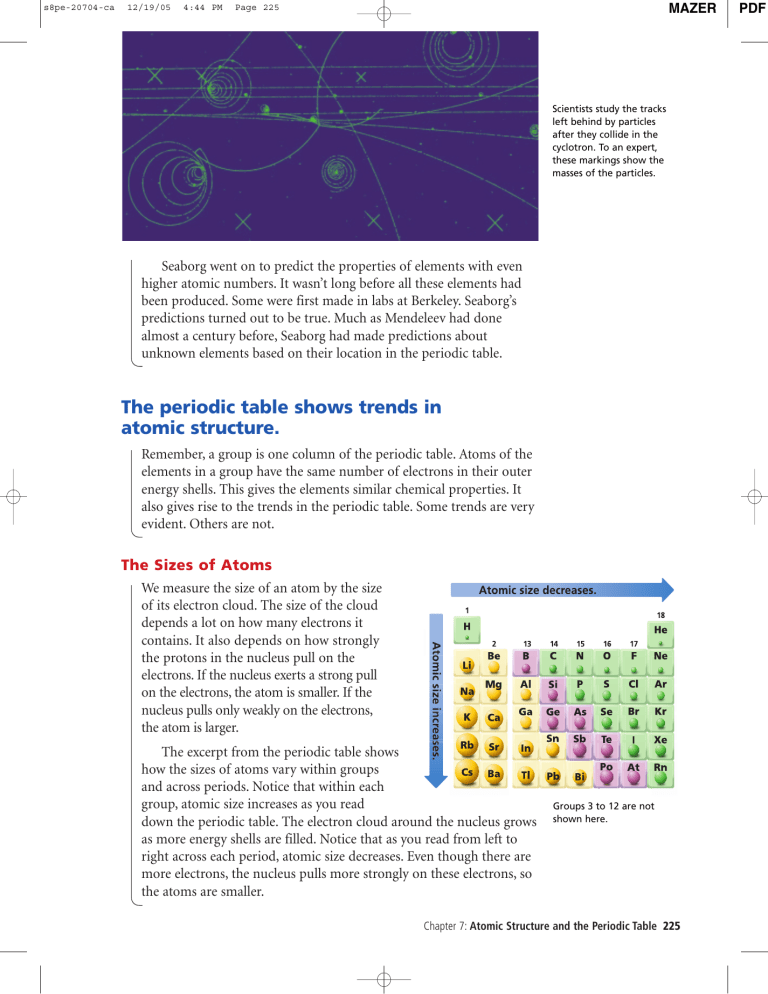
Scientists study the tracks left behind by particles after they collide in the cyclotron. To an expert, these markings show the masses of the particles.
Seaborg went on to predict the properties of elements with even higher atomic numbers. It wasn’t long before all these elements had been produced. Some were first made in labs at Berkeley. Seaborg’s predictions turned out to be true. Much as Mendeleev had done almost a century before, Seaborg had made predictions about unknown elements based on their location in the periodic table.
The periodic table shows trends in atomic structure.
Remember, a group is one column of the periodic table. Atoms of the elements in a group have the same number of electrons in their outer energy shells. This gives the elements similar chemical properties. It also gives rise to the trends in the periodic table. Some trends are very evident. Others are not.
The Sizes of Atoms
We measure the size of an atom by the size of its electron cloud. The size of the cloud depends a lot on how many electrons it contains. It also depends on how strongly the protons in the nucleus pull on the electrons. If the nucleus exerts a strong pull on the electrons, the atom is smaller. If the nucleus pulls only weakly on the electrons, the atom is larger.
The excerpt from the periodic table shows how the sizes of atoms vary within groups and across periods. Notice that within each group, atomic size increases as you read down the periodic table. The electron cloud around the nucleus grows as more energy shells are filled. Notice that as you read from left to right across each period, atomic size decreases. Even though there are more electrons, the nucleus pulls more strongly on these electrons, so the atoms are smaller.
Groups 3 to 12 are not shown here.
Chapter 7: Atomic Structure and the Periodic Table 225
