VOL. X, NO. X, XXXXXXXX
ISSN 1819-6608
ARPN Journal of Engineering and Applied Sciences
©2006-2015 Asian Research Publishing Network (ARPN). All rights reserved.
www.arpnjournals.com
TEMPERATURE DECREMENT RATE OF BATH TUB WATER FOR ICE
BATH THERAPY
M.Farid Husaini, S. Md Salleha, Zamani Ngali and Waluyo Adi Siswanto
Faculty of Mechanical and Manufacturing Engineering, Universiti Tun Hussein Onn Malaysia 86400,
Parit Raja, Batu Pahat, Johor, Malaysia.
E-Mail: asaliha@uthm.edu.my
ABSTRACT
The objectives of this study are to evaluate the decrement rate in the ice bath water temperature in different environment conditions and
study the decrement rate in the ice bath water temperature using a different pump capability. First, in the study of different environment
conditions, the decrement rate of water temperature were tested with and without top cover . In addition, both conditions were tested
with there environments i-exposed directly to sunlight, ii-exposed indirectly to sunlight and iii-tested in the air-conditioned rooms. The
study was done experimentally using a chiller provided by Institut Jantung Negara (ISN). Second,in the study of the decrement rate in
the ice bath water temperature, two pumps with Hilea chiller are considered. Two pumps with different flow rate were used using
Hailea chiller model HS-90A where 1400 litre per hour and 4000 litre per hour of pump were tested. All temperature data for each
experiment were taken and plotted in the graph using linear equation y = mx + c for each experiment. Using the equation, the duration of
time required for the ice bath water temperature reaches 12OC can be evaluated. Therefore, the best experimental conditions can be
determined through the shortest period of time. Where the test done in air-conditioned rooms and bath tub with top cover were the best
conditions for ice bath cooling process. Whereas, for the test with different pump flow rate, pump A with 1400 liter per hour has a better
rate of temperature decrease compared to pumps B with 4000 liters per hour.
Keywords: temperature decremnet
ice bath therapy
INTRODUCTION
Ice bath treatment has become a popular treatment to
overcome the "Delayed Onset Muscle Soreness" (DOMS).
DOMS is pain that occurs in muscles usually caused by
strenuous exercise (Armstrong, 1990). Usually, this
treatment is performed by immersing the athlete in a
container filled with water and ice. Water and ice cubes
will be entered into the containers provided. When the
temperature reached about 12 ° to 15 ° C, then an athlete
will be entered into the container filled with water and ice.
Immersion usually done for 10 to 15 minutes sometimes
can reach up to 20 minutes (Fatima, 2010). In addition, the
treatment of alternating cold and warm has also performed
as an alternative treatment for this therapy (Bleakly,
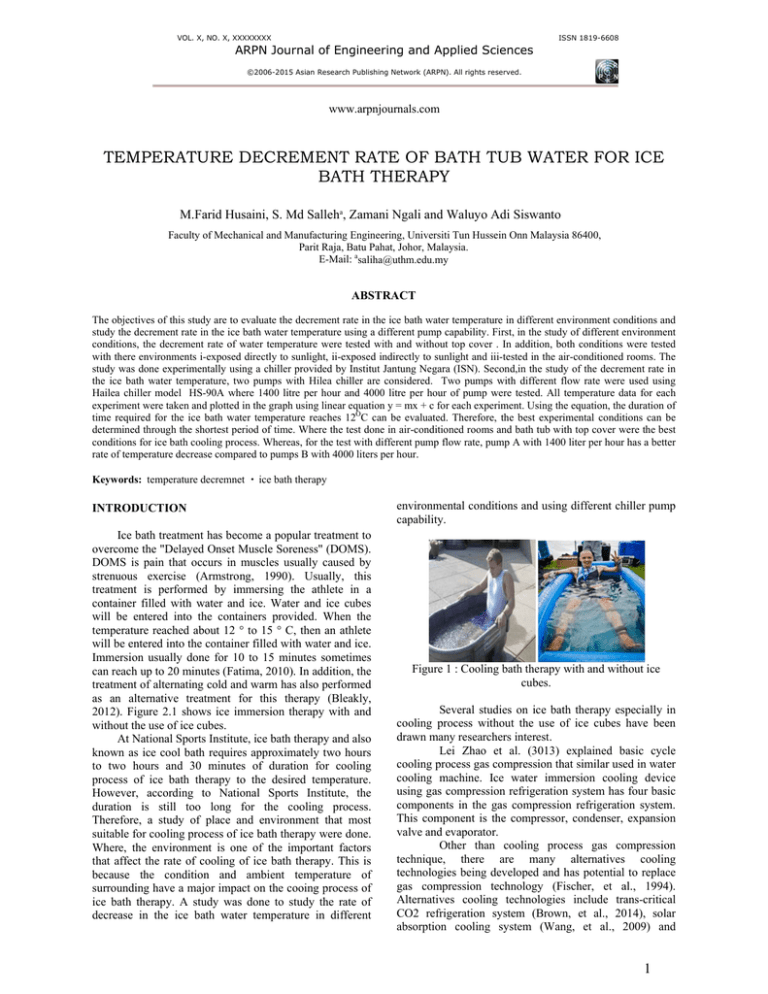
2012). Figure 2.1 shows ice immersion therapy with and
without the use of ice cubes.
At National Sports Institute, ice bath therapy and also
known as ice cool bath requires approximately two hours
to two hours and 30 minutes of duration for cooling
process of ice bath therapy to the desired temperature.
However, according to National Sports Institute, the
duration is still too long for the cooling process.
Therefore, a study of place and environment that most
suitable for cooling process of ice bath therapy were done.
Where, the environment is one of the important factors
that affect the rate of cooling of ice bath therapy. This is
because the condition and ambient temperature of
surrounding have a major impact on the cooing process of
ice bath therapy. A study was done to study the rate of
decrease in the ice bath water temperature in different
environmental conditions and using different chiller pump
capability.
Figure 1 : Cooling bath therapy with and without ice
cubes.
Several studies on ice bath therapy especially in
cooling process without the use of ice cubes have been
drawn many researchers interest.
Lei Zhao et al. (3013) explained basic cycle
cooling process gas compression that similar used in water
cooling machine. Ice water immersion cooling device
using gas compression refrigeration system has four basic
components in the gas compression refrigeration system.
This component is the compressor, condenser, expansion
valve and evaporator.
Other than cooling process gas compression
technique, there are many alternatives cooling
technologies being developed and has potential to replace
gas compression technology (Fischer, et al., 1994).
Alternatives cooling technologies include trans-critical
CO2 refrigeration system (Brown, et al., 2014), solar
absorption cooling system (Wang, et al., 2009) and
1
VOL. X, NO. X, XXXXXXXX
ISSN 1819-6608
ARPN Journal of Engineering and Applied Sciences
©2006-2015 Asian Research Publishing Network (ARPN). All rights reserved.
www.arpnjournals.com
thermo-acoustic refrigeration (Garrett, 2004). Transcritical CO2 refrigeration and solar absorption cooling
system has similar features to gas compression cooling.
Except for the coolant used is CO2 (R-744) and the heat
released into force on the critical temperature of the
coolant of 31 ° C compared to the commonly used
refrigerant which is 101.1 ° C for R-134a. Meanwhile in
solar absorption cooling system, thermal energy will be
replaced with mechanical energy from the solar collector
to drive condenser and compressor. In third technologies
of thermo-acoustic refrigeration, acoustic energy is
converted into heat energy. In which the acoustic wave
will react in expansion of thencoolant and thus reduces the
pressure and temperature of the coolant. The differences in
pressure will affected the process of cooling and heating .
Shahril (2015) studied differences in the time taken
to cool the water to the desired level when the inlet and
outlet pipes location were changed. It was found that pipe
arrangement plays an important role in the process of
cooling the ice water immersion. The results showed that
the position of the pipe placed at two opposite ends
provide fastest decreases in the water temperature
compared to other positions. The wider the distance
between the ends of pipes and pipe products enter the
shorter the time to lower the water temperature.
This study evaluates the decrement rate of
temperature in ice bath tub specifically for ice bath
therapy. The experiments had been conducted in two
conditions comprises different environmental temperature
and using coolant pump with different flow rate capability.
The next part will discussed on experimental set up and
testing procedures. The results then will be analysed and
discussed corresponds to the data acquired. Finally, the
conclusion will be made correspond to the aims of this
study.
EXPERIMENTAL SET UP AND TESTING
i.
ii.
iii.
iv.
v.
vi.
vii.
viii.
ISN Chiller + Bath Tub Without Top Cover
+ Without Direct Sunlight.
ISN Chiller + Bath Tub Without Top Cover
+ With Direct Sunlight.
ISN Chiller + Bath Tub Without Top Cover
+ Air-Conditioned Room.
ISN Chiller + Bath Tub With Top Cover +
Without Direct Sunlight.
ISN Chiller + Bath Tub With Top Cover +
With Direct Sunlight.
ISN Chiller + Bath Tub Without Top Cover
+ Air-Conditioned Room.
Hailea Chiller + Bath Tub With Top Cover +
Air-Conditioned Room + 1400 litre per hour
Pump.
Hailea Chiller + Bath Tub With Top Cover +
Air-Conditioned Room + 4000 litre per hour
Pump.
Set up for vii and viii are conditions for second testing.
Figure 1 and 2 show different chiller of ISN and Hilea
respectively.
Figure 1: ISN Chiller
Some experiments set-up have been made to obtain
the decrement rate of bath tub temperature. For the study
in different environment conditions, the decrement rate of
water temperature were tested with and without top cover .
In addition, both conditions were tested within
different environments i-exposed directly to sunlight,
ii-exposed indirectly to sunlight and iii-tested in the
air-conditioned rooms. The study was done
experimentally using a chiller provided by Institut
Jantung Negara (ISN). A chiller consists of basic
components such as a motor, compressor, condenser,
evaporator and the valve.Meanwhile for the study of
the decrement rate in the ice bath water temperature,
two pumps with Hilea chiller with different flow rate
capability of 1400 and 4000 litre per hour were
considered.
Figure 2: Hailea Chiller
Measurements were made using termocuple where it
can detect temperature changes of input and output
pipeline system. The sensor is then connected to the
TC-08 Thermocouple Data Logger that stores
temperature data during the experiment. Figure 3
The testing will be conducted with following
different set up :
showsbath tube that had been tested with top covered.
Positions of thermoucouple was located between inlet and
outlet pipe as shown in schematic diagram of Figure 4.
2
VOL. X, NO. X, XXXXXXXX
ISSN 1819-6608
ARPN Journal of Engineering and Applied Sciences
©2006-2015 Asian Research Publishing Network (ARPN). All rights reserved.
www.arpnjournals.com
ISN
Chiller +
Bath Tub
With Top
Cover
4) Without
Direct
Sunlight
0.106
5) Direct
Sunlight
0.0587
136.41
6) Air –
Conditioned
Room
0.1343
76.99
Rate of Temperature
Decrease
Time to
Rate of
reach
decrease,
12OC
m
(minute)
Test Condition
Hailea
Chiller +
Bath Tub
with Top
Cover + Air –
Conditioned
Room
Figure 4: Position of thermocouple,
inlet and outlet pipe.
RESULT AND DISCUSSION
Based on the data that been plotted in the
graph, the linear equation was derived for each test
condition. Then, the rate of decrease from the value
of m from equation y = mx + c. After that, time taken
for the temperature to reach 12OC was calculated to
see which condition has the shortest time needed to
reach 12OC.
Table 4.1: Result of time and rate of temperature
decreases for ISN chiller.
Test Condition
ISN
Chiller +
Bath Tub
Without
Top
Cover
1) Without
Direct
Sunlight
0.0796
2) Direct
Sunlight
0.0412
167.38
3) Air –
Conditioned
Room
0.1341
84.29
Test was
done in Air –
Conditioned
Room is the
best
Table 4.1: Result of time and rate of temperature
decreases for Hailea chiller.
Figure 3: Bath Tube
Rate of Temperature
Decrease
Time to
Rate of
reach
decrease,
12OC
m
(minute)
126.75
Conclusion
7) Pump
A1400
litre per
hour
8) Pump
B - 4000
litre per
hour
0.0346
126.75
0.0305
136.41
Conclusion
Test was
done using
pump A
with 1400
litre per
hour is the
best
From Figure 5 to Figure 7, temperature readings was
taken within 277 minutes in different day. The
highest temperature decreases at 0.134 for ISN
Chiller and bath tub without top cover were
observed in air conditioning room. Without exposed
to direct sunlight the temperature decrement 0.076 is
higher if compared with exposed to direct sunlight
i.e. 0.0412. Unsteady temperature under direct
sunlight do not facilitate the process of cooling.
Testing within lab environment aircond was
observed that time to reach 120C in 84.295s is the
shortest.
Ambient Temperature
Inlet water Temperature
Outlet water Temperature
°C
30
20
150.04
Test was
done in Air
– Cond
Room is the
best.
10
Min
0
50
100
150
200
250
Figure 5: Graph for test condition i.
3
VOL. X, NO. X, XXXXXXXX
ISSN 1819-6608
ARPN Journal of Engineering and Applied Sciences
©2006-2015 Asian Research Publishing Network (ARPN). All rights reserved.
www.arpnjournals.com
°C
Channel 1
Channel 7
Channel 8
Inlet Water Temperature
Outlet Water Temperature
°C
Channel 6
40
30
30
20
20
10
10
Min
0
Min
0
50
100
150
200
250
100
150
200
250
Figure 9: Graph for test condition v.
300
Figure 6: Graph for test condition ii.
°C
Outlet Water Temperature
Ambient Temperature
Inlet Water Temperature
°C
50
Outlet water Temperature
inlet water temperature
ambient temperature
20
20
15
15
10
10
Min
5
5
0
Min
0
20
40
60
80
100
120
140
Figure 7: Graph for test condition iii.
From Figure 8 to Figure 10,temperature readings
were recorded for bath tub with top cover with
similar duration in different day. Without exposed to
direct sunlight the temperature decrement 0.1343 is
higher if compared with exposed to direct sunlight
i.e. 0.0587. However steady temperature under direct
sunlight also do not facilitate the process of cooling.
Testing within lab environment aircond was
observed that time to reach 120C in 84.295s is the
shortest.Comparing both data, it shows that bath tube
with top cover and air condition room arrangement,
still has a room of improvement.
20
40
60
80
100
120
Figure 10: Graph for test condition vi.
Using Hailea Chiller with environment of bath tub
and top cover and under air conditioning room,
Figure 11 and 12 shows linear correlation between
1400 l/hour and 4000 l/hour pumps.It also seen that
overuse of 4000l/hour as its performance. This
means that high flow rate pump does not necessarily
give a higher temperature decrease rate.
°C
Outlet
Ambient
25
20
15
10
°C
Water Outlet Temperature
Water Inlet Temperature
Ambient Tempereture
Min
0
100
200
300
400
Figure 11: Graph for test condition vii.
°C
25
Outlet
Channel 5
25
20
20
15
10
15
Min
5
0
50
100
150
Min
200
0
Figure 8: Graph for test condition iv.
50
100
150
200
250
300
Figure 12: Graph for test condition viii.
4
VOL. X, NO. X, XXXXXXXX
ISSN 1819-6608
ARPN Journal of Engineering and Applied Sciences
©2006-2015 Asian Research Publishing Network (ARPN). All rights reserved.
www.arpnjournals.com
CONCLUSION
REFERENCE
Experimental conditions in air-conditioned rooms
has the highest drop in temperature compared to
other conditions. Meanwhile, the condition of the
experiment that without direct sunlight is the second
highest in both experiments. Direct sunlight
experimental condition has the lowest value
compared to others. For the experimental conditions
using pumps, pump A with flow rate 1400 liters per
hour had the highest decrease of temperatures below
10° C compare to pump B that has 4000 liter per
hour flow rate.. This shows that the pump with
higher flow rate does not necessarily give higher rate
of temperature decrease especially in ice water
immersion.
Overall, the state and the best place to carry ice
water immersion chilling process are in the airconditioned rooms and bath tub with top cover. In
addition, using a pump capable of much higher flow
rates do not necessarily mean that the increase in the
rate of decrease in temperature. Therefore, a suitable
pump should be used to get the best rate of
temperature decrease.
[1]
Armstrong R.B. (1990), Initial events in
exercise-induced muscular injury, Medicine and
Science in Sports and Exercise, 22, pp. 429-435
[2]
Clarkson P.M. & Sayers, S.P. (1999) . Etiology
of exercise-induced muscle damage, Canadian
Journal of Applied Physiology, 24, pp. 234–248
[3]
Bleakley, C.M., Glasgow, P., & Webb, M.J.
(2012). Cooling an acute muscle injury: can
basic scientific theory translate into the clinical
setting?, British Journal of Sport Medicine, 46,
pp. 296-298
[4]
Fatimah Lateef (2010) , Post exercise ice water
immersion: Is it a form of active recovery?,
Journal of Emergencies, Trauma and Shock,
[5]
Yunus A.Cengel, Afshin J. Ghajar, 2011, Heat
and Mass Transfer Fundementals and
Applications, Amaricas,New York :Mcgraw-Hill
5


