Distorted low-level signal readback of AC signals in the PPMS in the
advertisement
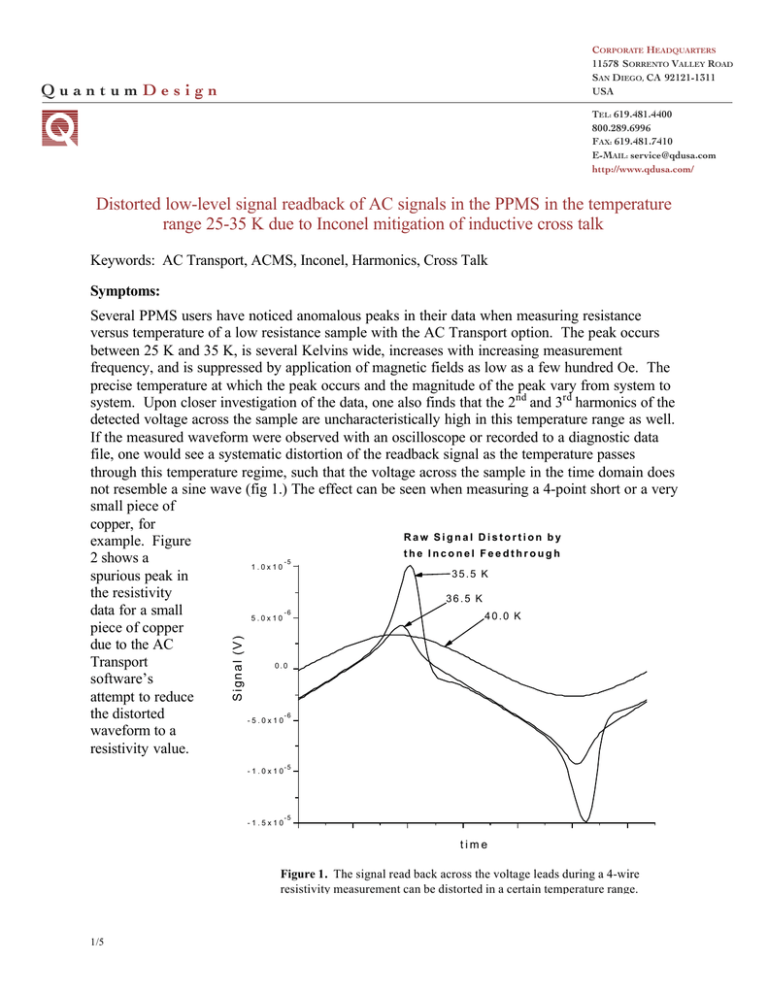
CORPORATE HEADQUARTERS 11578 SORRENTO VALLEY ROAD SAN DIEGO, CA 92121-1311 USA QuantumDesign TEL: 619.481.4400 800.289.6996 FAX: 619.481.7410 E-MAIL: service@qdusa.com http://www.qdusa.com/ Distorted low-level signal readback of AC signals in the PPMS in the temperature range 25-35 K due to Inconel mitigation of inductive cross talk Keywords: AC Transport, ACMS, Inconel, Harmonics, Cross Talk Symptoms: Signal (V) Several PPMS users have noticed anomalous peaks in their data when measuring resistance versus temperature of a low resistance sample with the AC Transport option. The peak occurs between 25 K and 35 K, is several Kelvins wide, increases with increasing measurement frequency, and is suppressed by application of magnetic fields as low as a few hundred Oe. The precise temperature at which the peak occurs and the magnitude of the peak vary from system to system. Upon closer investigation of the data, one also finds that the 2nd and 3rd harmonics of the detected voltage across the sample are uncharacteristically high in this temperature range as well. If the measured waveform were observed with an oscilloscope or recorded to a diagnostic data file, one would see a systematic distortion of the readback signal as the temperature passes through this temperature regime, such that the voltage across the sample in the time domain does not resemble a sine wave (fig 1.) The effect can be seen when measuring a 4-point short or a very small piece of copper, for Raw Signal Distortion by example. Figure the Inconel Feedthrough 2 shows a -5 1.0x10 35.5 K spurious peak in the resistivity 36.5 K data for a small -6 40.0 K 5.0x10 piece of copper due to the AC Transport 0.0 software’s attempt to reduce -6 the distorted -5.0x10 waveform to a resistivity value. -1.0x10 -1.5x10 -5 -5 time Figure 1. The signal read back across the voltage leads during a 4-wire resistivity measurement can be distorted in a certain temperature range. 1/5 Effects of Distorted Signal on Resistivity Measurements of Copper with the AC Transport Resistivity Calculated by AC Transport Software (Ohm-cm) 0.000020 0.000018 0.000016 false peak due to distorted signal readback 0.000014 0.000012 0.000010 0.000008 0.000006 0.000004 15 20 25 30 35 40 45 Temperature (K) Figure 3. The distorted signal can lead to misleading resistivity values due to inappropriate data reduction. The same phenomenon also manifests itself in AC resistivity measurements performed in the PPMS with third party instrumentation, as well as in AC susceptibility measurements performed with the ACMS option. The phenomenon in ACMS measurements appears to be a small (< 0.5 degree) systematic change in otherwise steady phase data (see figure 3.) The effect can be seen in the data from the ACMS calibration coil measurement steps, meaning that the ACMS can at least partially correct for the effect. While noticeable, this effect tends to be below the ACMS system’s true sensitivity, appearing only as small phase shifts, and therefore should not pose a reasonable obstacle to collecting good AC susceptibility data in the ACMS. Effects of Distorted Signal on AC Moment Measurements of Dysprosium Oxide in the ACMS 0.00026 Amplitude 0.05 Phase 0.00022 0.00 0.00020 -0.05 0.00018 Phase (deg) Moment (emu) 0.00024 0.00016 -0.10 0.00014 20 25 30 35 40 45 Temperature (K) Figure 2. Signal distortion can cause small shifts in the phase data for AC susceptibility measurements in the ACMS. 2/5 Cause AC Moment, m' (emu) The fact that the effect increases with measurement frequency indicates that it is inductive in nature. But the temperature and field dependence suggest that some material’s physical properties also play a role. The source of this behavior is in fact the inconel electrical feedthrough at the bottom of the PPMS sample chamber that the puck interface plugs into. The inconel in the electronic vacuum feedthrough has a peak in its Real Component of the AC Moment of Inconel-X in Small Fields at Various Temperatures instantaneous susceptibility curve, 0.005 Excitation = 1.5 Oe, 100 Hz 25 K χac(T), around 25 K-30 K. The Performed in MPMS 30 K inconel mitigates inductive cross 0.004 talk between the excitation circuit 35 K and the sensitive voltage detection 20 K 40 K 0.003 circuit where the lead twisting stops to pass through the 45 K 50 K feedthrough, distorting the 0.002 15 K inducted waveform. The resulting effect is similar to an inductor core 0.001 with changing permeability. The distorted waveform is not handled well by the AC Transport 0.000 -100 -50 0 50 100 software’s data reduction routines. Field (Oe) Imaginary Component of the AC Moment 0.00025 of Inconel-X in Small Fields at Various Temperatures Excitation = 1.5 Oe, 100 Hz Performed in MPMS AC Moment, m'' (emu) 0.00020 20 K 0.00015 0.00010 15 K 25 K 0.00005 0.00000 30 K -0.00005 -100 50 K 45 K -50 35 K 40 K 0 50 100 Field (Oe) Figure 4. The real (top) and imaginary (bottom) components of the AC moment of a sample of the inconel feedthrough in the PPMS sample chamber. The data indicate that the instantaneous susceptibility of the sample has a peak around between 25 and 30 K in zero magnetic field. The small offset between zero field and the peaks is an instrumental offset in field reporting. 3/5 Inconel is a standard material used for vacuum-tight feedthroughs in cryogenic applications. It is a nickel super-alloy in the same family as stainless steel. The variability of the noted effect from PPMS sample chamber to sample chamber is believed to be due to variations in the treatment of the individual inconel feedthroughs. The AC moment of a small piece of this material when measured with a constant alternating field of 1.5 Oe is shown in figure 4. When changing temperature the changing susceptibility of the material clearly reverses directions between 25 K and 30 K. Also, fields of 100 Oe and less seem to saturate the sample, so that its susceptibility does not change much with further changes in field or temperature. The result of these material properties is that the feedthrough can amplify the flux through the detection circuit enough to induce measurable amounts of cross-talk when the resistive voltage across the sample itself is quite small and the current through the excitation circuit is quite large. Figure 5 illustrates the geometry of the cross-talking circuits. As a magnetic field is applied, or the temperature of the sample chamber moves outside the regime where the inconel has a significant AC susceptibility, the inconel no longer mitigates the cross talk between the excitation circuit and the detection circuit, so phase-sensitive detection will effectively filter out the cross talk. It is only in zero magnetic field and at the temperatures noted above that the cross talk cannot be filtered out due to the intervening physical properties of the inconel. Figure 5. The approximate geometry of the electrical feedthrough on the bottom of the PPMS sample chamber illustrates how alternating current through two contacts can create a small oscillating magnetic dipole that is detected by voltage taps at another pair of contacts. Changes in the inconel susceptibility with temperature amplify or distort the effect. Solutions Unfortunately, there is no practical way to replace the Inconel feedthrough on the PPMS sample chamber. To physically avoid passing any electrical currents through the Inconel material, one might wish to avoid the PPMS sample puck interface altogether and feed new wires into the sample chamber from the top for electrical measurements. This could be accomplished using the PPMS multifunction probe, for example. Short of creating a new electrical feedthrough, other suggestions to minimize the effect are as follows: a) Keep the drive frequency as low as practically possible. Resistivity measurements will vary with drive amplitude, but should not vary with frequency. Frequency dependence is a reactive phenomenon. Because the phenomenon of concern here is reactive, keeping the drive frequency low (or measuring with DC) will keep the cross talk to a minimum. b) Increase the signal from the sample without increasing the drive amplitude (which causes the cross talk). Try greater voltage lead separation, for example, or a sample with smaller crosssection. 4/5 Be sure to watch the fit quality for reduced data and values of 2nd and 3rd harmonic contribution to the signal of interest. These are strong clues indicating the quality of the measured signal. Reading Quantum Design Application Note 1584-202, “Inductive Cross-talk During Alternating Current Measurements: Guidelines for Sensitive Measurements,” is also recommended. 5/5

