Lab 24 - Mt. SAC
advertisement

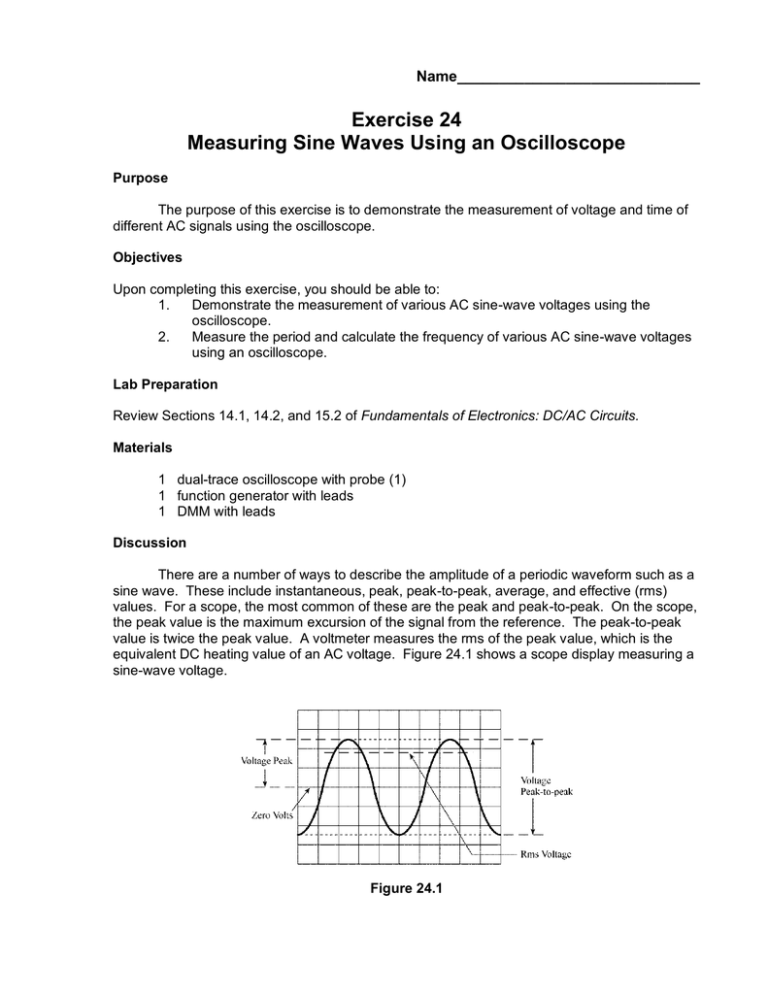
Name_____________________________ Exercise 24 Measuring Sine Waves Using an Oscilloscope Purpose The purpose of this exercise is to demonstrate the measurement of voltage and time of different AC signals using the oscilloscope. Objectives Upon completing this exercise, you should be able to: 1. Demonstrate the measurement of various AC sine-wave voltages using the oscilloscope. 2. Measure the period and calculate the frequency of various AC sine-wave voltages using an oscilloscope. Lab Preparation Review Sections 14.1, 14.2, and 15.2 of Fundamentals of Electronics: DC/AC Circuits. Materials 1 dual-trace oscilloscope with probe (1) 1 function generator with leads 1 DMM with leads Discussion There are a number of ways to describe the amplitude of a periodic waveform such as a sine wave. These include instantaneous, peak, peak-to-peak, average, and effective (rms) values. For a scope, the most common of these are the peak and peak-to-peak. On the scope, the peak value is the maximum excursion of the signal from the reference. The peak-to-peak value is twice the peak value. A voltmeter measures the rms of the peak value, which is the equivalent DC heating value of an AC voltage. Figure 24.1 shows a scope display measuring a sine-wave voltage. Figure 24.1 In Part I of the exercise, you will use the DMM to set up an rms value of AC and then use a scope to measure the corresponding peak and peak-to-peak values. In Part II of the exercise you will measure the period and then calculate the corresponding frequency of various sine-wave signals. Remember to refer to Exercise 23 for help in establishing the normal positions for all scope controls. Procedure Part I 1. Connect the DMM (AC volts position) to the function generator terminals. (See Figure 24.2.) Figure 24.2 2. Select the sine-wave output. Adjust the generator output to provide a 1-V rms sine wave at a frequency of about 1 kHz (frequency control to 1 and range to 1 kHz). Keep the generator at this frequency for all steps in Part I. 3. Connect the scope across the generator output. Observe the sine-wave signal on the scope. Center the reference line on the graticule for CH 1. Readjust the scope controls from the normal settings as necessary in order to display the signal. Adjust the VOLTS/DIV setting to maximize the signal displayed on the screen. This ensures more accurate readings. Draw the waveform on the graticule provided. Table 24.1 Amplitude Values Measured rms (DMM) VOLTS/DIV Selected # of Divisions Measured Pk-Pk Value Measured Peak Value Calculated rms value 1V 2V 3V 4V 5V 6V 4. Record the VOLTS/DIV setting selected and the number of divisions the signal deflects in Table 24.1. Then determine the peak-to-peak value and peak value of the signal and record these values in Table 24.1. Finally, calculate the rms voltage and record in Table 24.1. 5. Repeat Step 4 for the other rms values listed in Table 24.1. Part II 6. Connect the scope probe to the generator terminals. 7. Select the sine-wave output and set the frequency to 500 Hz. Adjust the amplitude control for a 5-V pp signal. 8. Adjust the TIME/DIV as necessary in order to maximize the signal displayed horizontally. Draw the waveform on the graticule provided. 9. 10. Measure and record the number of divisions (horizontally) in one cycle and the TIME/DIV setting selected. Determine the period and frequency of the signal. Record these values in Table 24.2. Repeat Step 9 for the other frequencies listed in Table 24.2. Generator Setting TIME/DIV Setting Table 24.2 # of Divisions per Cycle Period, s Frequency, Hz (f = 1/T) 500 Hz 1 kHz 10 kHz 50 kHz 100 kHz 250 kHz 500 kHz Questions 1. An oscilloscope set on 2 ms/DIV has a wave shape that has 4.5 divisions for one cycle. What are the period and frequency of the waveform? 2. The peak-to-peak voltage of a sine wave covers 5.5 divisions on an oscilloscope set at 5 V/DIV. What are the peak, peak-to-peak, and rms values of this waveform? 3. Why must you have the vertical and horizontal verniers in the CAL position when making actual voltage and time measurements? 4. An oscilloscope displays ______ on the horizontal axis and ________ on the vertical axis. 5. Solve for the peak-to-peak values, period, and frequency of the sine wave shown. The VOLTS/DIV is set for 0.2 V/DIV and the TIME/DIV is set at 50 s/DIV. Pk-Pk = _______________ Period = ______________ Frequency = ______________ 6. What are the advantages of using an oscilloscope rather than a DMM? Explain.


