to read (or right click to download)
advertisement

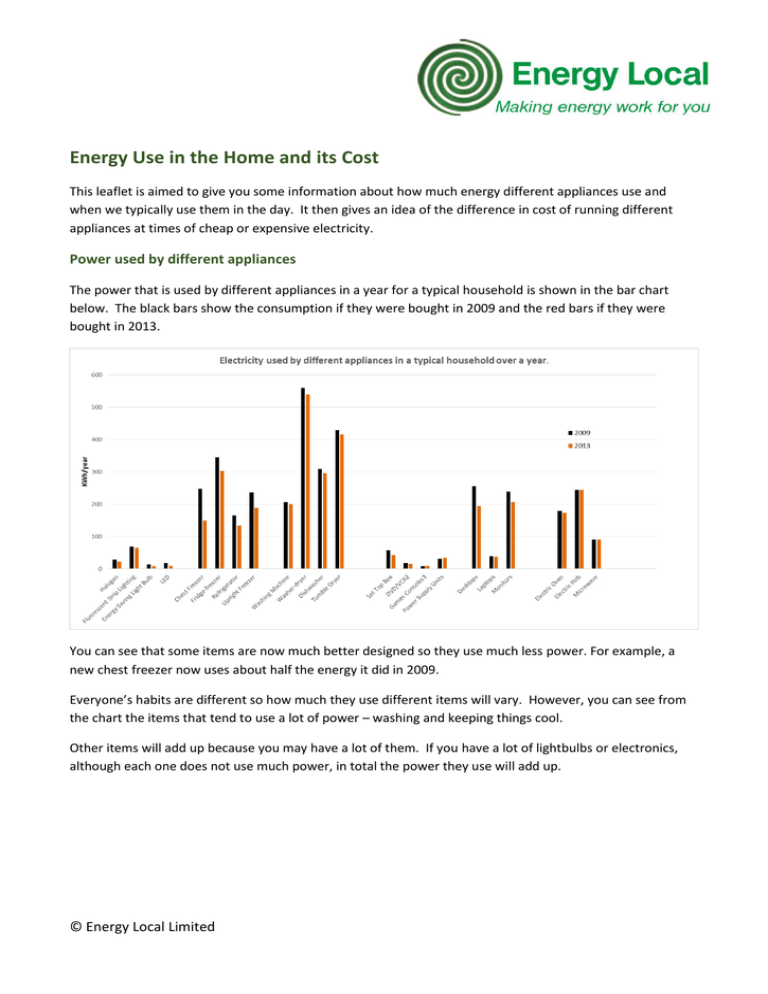
Energy Use in the Home and its Cost This leaflet is aimed to give you some information about how much energy different appliances use and when we typically use them in the day. It then gives an idea of the difference in cost of running different appliances at times of cheap or expensive electricity. Power used by different appliances The power that is used by different appliances in a year for a typical household is shown in the bar chart below. The black bars show the consumption if they were bought in 2009 and the red bars if they were bought in 2013. You can see that some items are now much better designed so they use much less power. For example, a new chest freezer now uses about half the energy it did in 2009. Everyone’s habits are different so how much they use different items will vary. However, you can see from the chart the items that tend to use a lot of power – washing and keeping things cool. Other items will add up because you may have a lot of them. If you have a lot of lightbulbs or electronics, although each one does not use much power, in total the power they use will add up. © Energy Local Limited When do we use different appliances and how much does it cost? Below is a graph of when we typically use different appliances during the day. Quite a lot of a household's energy use is ‘unknown’. This could be anything that plugs in e.g. vacuuming, ironing, hairdryers, toasters…. Again, every house will be different. Not surprisingly households do a lot of cooking in the evening and electric showers are used in the morning and evening. Under Energy Local, power will cost different amounts at different times of day. The next tables show the typical annual running costs for appliances if the power costs different amounts. Remember, power will be more expensive during the evening with an Energy Local tariff. These figures are for typical usage during a year, some people will use some appliances more. For example, if you more washing than average, your washing machine costs for the year will be higher. © Energy Local Limited The first table shows typical costs over the year for: Lighting – this is hard to schedule without a battery but the table shows the difference in cost when efficient lighting is used. Fridges and freezers - eventually these could be cooled during times of cheaper power. ‘Wet appliances’ for laundry that you could schedule to run at times of cheaper power. . price £/kWh 0.06 0.08 0.10 0.12 0.14 0.16 0.18 Saving if power costs £0.06 instead of £0.14/kWh Halogen (£) 1.36 1.81 2.26 2.71 3.17 3.62 4.07 Fluoresc ent Strip Lighting (£) 3.92 5.23 6.54 7.85 9.15 10.46 11.77 1.81 5.23 Energy Saving LED Light lighting Bulb (£) (£) 0.53 0.57 0.71 0.76 0.88 0.95 1.06 1.14 1.24 1.33 1.42 1.52 1.59 1.70 0.71 Chest FridgeUpright Freezer freezer Refrigera Freezer (£) (£) tor (£) (£) 8.96 18.15 8.05 11.33 11.95 24.21 10.73 15.11 14.94 30.26 13.42 18.88 17.92 36.31 16.10 22.66 20.91 42.36 18.78 26.44 23.90 48.41 21.47 30.21 26.89 54.46 24.15 33.99 0.76 11.95 24.21 10.73 Washing Dish Machine Washerwasher Tumble (£) dryer (£) (£) Dryer (£) 12.03 32.36 17.76 24.98 16.04 43.15 23.68 33.31 20.05 53.93 29.60 41.64 24.06 64.72 35.52 49.97 28.07 75.51 41.45 58.29 32.08 86.29 47.37 66.62 36.09 97.08 53.29 74.95 15.11 16.04 43.15 23.68 33.31 The second table shows typical costs over the year for: IT and electronics – those with batteries can be charged during times of cheap power. Cooking and electronics – you could change your routine to save money. price £/kWh 0.06 0.08 0.1 0.12 0.14 0.16 0.18 Saving if power costs £0.06 instead of £0.14/kWh Games Power Set Top DVD/VCR Consoles Supply Box (£) 2 (£) 3 (£) Units (£) 2.50 0.96 0.57 2.00 3.33 1.27 0.76 2.67 4.17 1.59 0.95 3.34 5.00 1.91 1.15 4.01 5.84 2.23 1.34 4.68 6.67 2.55 1.53 5.34 7.50 2.87 1.72 6.01 3.33 1.27 0.76 2.67 Please send any questions to energy@weset.org or ring 07811085661 © Energy Local Limited Desktops Laptops Monitors (£) (£) (£) 11.63 2.23 12.40 15.51 2.97 16.54 19.39 3.72 20.67 23.27 4.46 24.80 27.14 5.20 28.94 31.02 5.95 33.07 34.90 6.69 37.21 15.51 2.97 16.54 Electric Electric Microwave Oven (£) Hob (£) (£) 10.34 14.66 5.44 13.79 19.55 7.26 17.24 24.44 9.07 20.69 29.33 10.89 24.13 34.22 12.70 27.58 39.11 14.52 31.03 43.99 16.33 13.79 19.55 7.26


