Binomial Distribution: Mean & Standard Deviation
advertisement
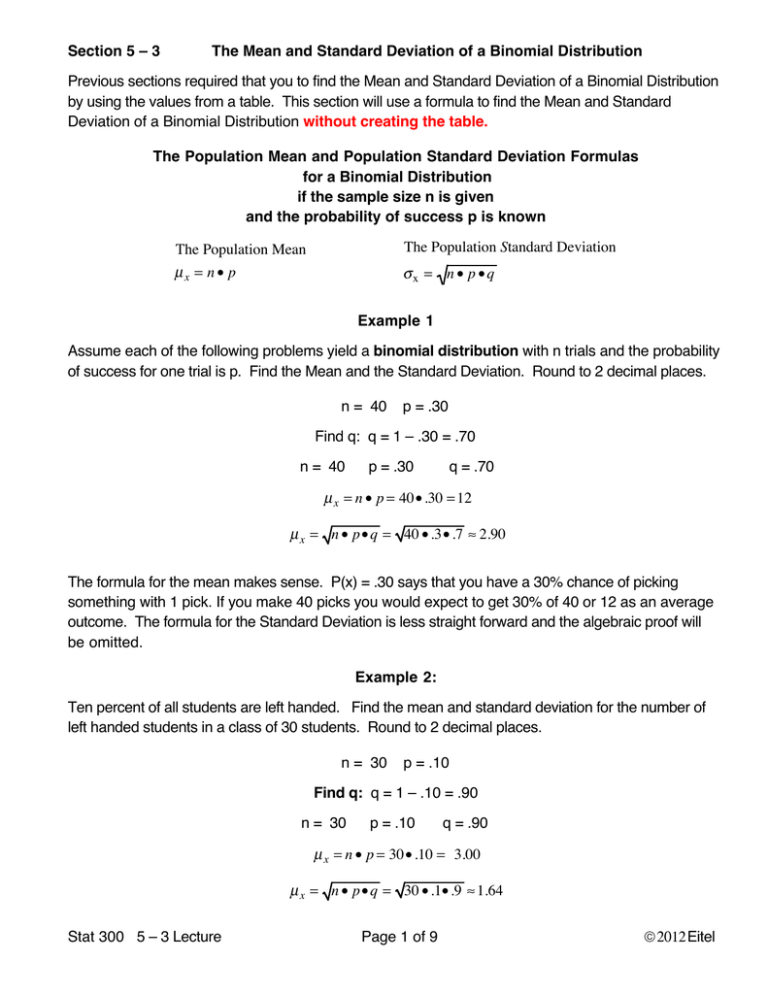
Section 5 – 3 The Mean and Standard Deviation of a Binomial Distribution Previous sections required that you to find the Mean and Standard Deviation of a Binomial Distribution by using the values from a table. This section will use a formula to find the Mean and Standard Deviation of a Binomial Distribution without creating the table. The Population Mean and Population Standard Deviation Formulas for a Binomial Distribution if the sample size n is given and the probability of success p is known The Population Standard Deviation The Population Mean µx = n • p σx = n • p • q Example 1 Assume each of the following problems yield a binomial distribution with n trials and the probability of success for one trial is p. Find the Mean and the Standard Deviation. Round to 2 decimal places. n = 40 p = .30 Find q: q = 1 – .30 = .70 n = 40 p = .30 q = .70 µ x = n • p = 40• .30 = 12 µ x = n • p• q = 40 • .3• .7 ≈ 2.90 The formula for the mean makes sense. P(x) = .30 says that you have a 30% chance of picking something with 1 pick. If you make 40 picks you would expect to get 30% of 40 or 12 as an average outcome. The formula for the Standard Deviation is less straight forward and the algebraic proof will be omitted. Example 2: Ten percent of all students are left handed. Find the mean and standard deviation for the number of left handed students in a class of 30 students. Round to 2 decimal places. n = 30 p = .10 Find q: q = 1 – .10 = .90 n = 30 p = .10 q = .90 µ x = n • p = 30• .10 = 3.00 µ x = n • p• q = 30 • .1• .9 ≈ 1.64 Stat 300 5 – 3 Lecture Page 1 of 9 © 2012 Eitel Is the Binomial Probability Distribution a Bell Shaped Distribution? In general, a Binomial Probability Distribution IS NOT a Bell Shaped Distribution. As the number of trials (n) becomes larger or if the value of p becomes closer to .5 then the distribution becomes more bell shaped If p > .5 then the distribution is Skewed Left (Long Tail to the Left) x P(x) 1 .01 If the probability of a success is more than 2 .02 .5 ( p > .5) the distribution is skewed 3 .04 left. A distribution that is skewed has the 4 .08 5 .10 6 .12 7 .18 8 .25 9 .20 smallest probabilities and lowest rectangles on the left side of a probability histogram. It has the smaller values for P(X) at the top of the probability distribution table. If p < .5 then the distribution is Skewed Right (Long Tail to the Right) Stat 300 5 – 3 Lecture x P(x) 1 .20 If the probability of a success is less than 2 .25 .5 ( p < .5) the distribution is skewed 3 .18 right. A distribution that is skewed has 4 .12 5 .10 6 .08 7 .04 8 .02 9 .01 Page 2 of 9 the smallest probabilities and lowest rectangles on the right side of a probability histogram. It has the smaller values for P(X) at the bottom of the probability distribution table. © 2012 Eitel Binomial Distributions with a fixed value for p For any given p as n gets larger the Binomial Distribution gets more bell shaped n = 7 n = 16 n = 25 Stat 300 5 – 3 Lecture Page 3 of 9 © 2012 Eitel When Is the Binomial Probability Distribution a Bell Shaped Distribution? If the probability of a success is .5 (p = .5) then the distribution is exactly bell shaped or normal. x P(x) 1 .02 2 .08 3 .13 4 .17 5 .20 6 .17 7 .13 8 .08 9 .02 If both n • p ≥ 5 AND n • q ≥ 5 are true then the Binomial Distribution is not bell shaped but the distribution can be considered close enough to bell shaped to be considered bell shaped. x P(x) 1 .02 2 .08 3 .13 4 .16 5 .21 6 .18 7 .11 8 .07 9 .04 If both n • p ≥ 5 AND n • q ≥ 5 are true than the distribution can be considered close enough to bell shaped to be considered bell shaped. . Stat 300 5 – 3 Lecture Page 4 of 9 © 2012 Eitel When Is the Binomial Probability Distribution a Bell Shaped Distribution? The Binomial Probability Distribution can be considered approximately bell shaped if p = .5 or if n • p ≥ 5 AND n • q ≥ 5 are both true The requirement that n • p ≥ 5 AND n • q ≥ 5 for the distribution to be bell shaped (normal) while very common is not standard. Some textbooks require that np ≥ 10 and nq ≥ 10. Others chose different tests. The Michael Sullivan Statistics book uses the test n • p • q ≥ 10 for the Binomial Probability Distribution to be considered approximately bell shaped and quotes “P. H. Ramsey: Journal Of Educational Statistics 1998 V-13” Since the Binomial Probability Distribution is not Bell Shaped unless p = .5 any test is based on how close to Bell Shaped you are satisfied with. Example 1 n = 60 p = .60 n • p = 36 q = .40 n • q = 24 Is the Binomial Distribution Bell Shaped? Yes n • p ≥ 5 AND n • q ≥ 5 are both true Example 2 n= 4 p = .5 q = .5 Is the Binomial Distribution Bell Shaped? Yes ( p = 5) Example 3 n = 24 p = .8 n • p = 19.2 q = .2 n • q = 4.8 Is the Binomial Distribution Bell Shaped? No Stat 300 5 – 3 Lecture n • p ≥ 5 AND n • q ≥ 5 are not both true Page 5 of 9 © 2012 Eitel Unusual values for a Binomial Probability Distribution A Binomial Probability Distribution is Bell Shaped (Normal) if p = .5 OR if n • p ≥ 5 and n • q ≥ 5 are both true For Binomial Probability Distributions that are Bell Shaped The range of usual values of x are the x values within 2 standard deviations on either side of the mean x is usual if µ x − 2σ x ≤ x ≤ µ x + 2σ x Unusual values are more than 2 standard deviations to either side of the mean x is unusual if x < µx − 2σ x or x > µx + 2σ x Note: We do not compute Unusual or Usual Values for distributions that are not bell shaped. Stat 300 5 – 3 Lecture Page 6 of 9 © 2012 Eitel Example 1 30 percent of all students at FLC live north of the river. Find the mean and standard deviation for the number of students who live north of the river in a class of 60 students. Round to 2 decimal places. n = 60 p = .30 Find µx = _________ n • p = _____ n • q = _____ Find σ x = _________ Is the Binomial Distribution Bell Shaped? _______ If the Binomial Distribution is Bell Shaped what is the range of usual values? Would it be unusual to have a class of 60 students have 17 students that live north of the river? Would it be unusual to have a class of 60 students have 2 students that live north of the river? Solution: Find q: q = 1 – .30 = .70 n = 60 p = .30 q = .70 Mean: µ x = n • p = 60 • .30 = 18 SD: µ x = n • p• q = 60• .3• .7 ≈ 3.55 n • p = 18 n • q = 42 Is the Binomial Distribution Bell Shaped? Yes ( np ≥ 5 AND nq ≥ 5) x is usual if µ x − 2σ x ≤ x ≤ µ x + 2σ x 10 − 2(3.55) ≤ x ≤ 10 + 2(3.55) 2.9 ≤ x ≤ 17.1 Would it be unusual in a class of 60 students to have 17 students that live north of the river? NO Would it be unusual in a class of 60 students to have 2 students that live north of the river? Yes Stat 300 5 – 3 Lecture Page 7 of 9 © 2012 Eitel Example 2 A basketball player makes 60% of her free throws. Find the mean and standard deviation for the number of free throws made if she shoots 150 free throws. Round to 2 decimal places. n = 150 p = .60 n • p = _____ Find µx = _________ n • q = _____ Find σ x = _________ Is the Binomial Distribution Bell Shaped? _______ If the Binomial Distribution is Bell Shaped what is the ranges of usual values? Would it be unusual for the player to make 115 out of 150 free throws? Would it be unusual for the player to make 80 out of 150 free throws? Solution: Find q: q = 1 – .60 = .40 n = 150 p = .60 q = .40 Mean: µ x = n • p = 150 • .60 = 90 SD: µ x = n • p• q = 150• .6 • .4 = 6 n • p = 90 n • q = 60 Is the Binomial Distribution Bell Shaped? Yes ( np ≥ 5 AND nq ≥ 5) x is usual if µ x − 2σ x ≤ x ≤ µ x + 2σ x 90 − 2(6) ≤ x ≤ 90 + 2(6) 78 ≤ x ≤ 102 Would it be unusual for the player to make 115 out of 150 free throws? Yes Would it be unusual for the player to make 80 out of 150 free throws? No Stat 300 5 – 3 Lecture Page 8 of 9 © 2012 Eitel Example 3 Marʼs Company states that 14% of its M&M candies are colored yellow. Find the mean and standard deviation for the number of yellow M&Mʼs in a bag with 30 M&Mʼs. Round to 2 decimal places. n = 30 p = .14 Find µx = _________ n • p = _____ n • q = _____ Find σ x = _________ Is the Binomial Distribution Bell Shaped? _______ If the Binomial Distribution is Bell Shaped what is the ranges of usual values? Would it be unusual for a bag of 30 M&Mʼs to have 24 yellow M&Mʼs? Would it be unusual for a bag of 30 M&Mʼs to have 6 yellow M&Mʼs? Solution: Find q: q = 1 – .14 = .86 n = 30 p = .14 q = .86 Mean: µ x = n • p = 30• .14 = 4.2 SD: µ x = n • p• q = 30 • .14 • .86 ≈ 1.90 n • p = 4.2 n • q = 25.8 Is the Binomial Distribution Bell Shaped? NO neither p = 5 OR ( np ≥ 5 AND nq ≥ 5) are TRUE We cannot find usual or unusual values in a distribution that is not normal (or approximately normal) Stat 300 5 – 3 Lecture Page 9 of 9 © 2012 Eitel

