Document 17612590
advertisement
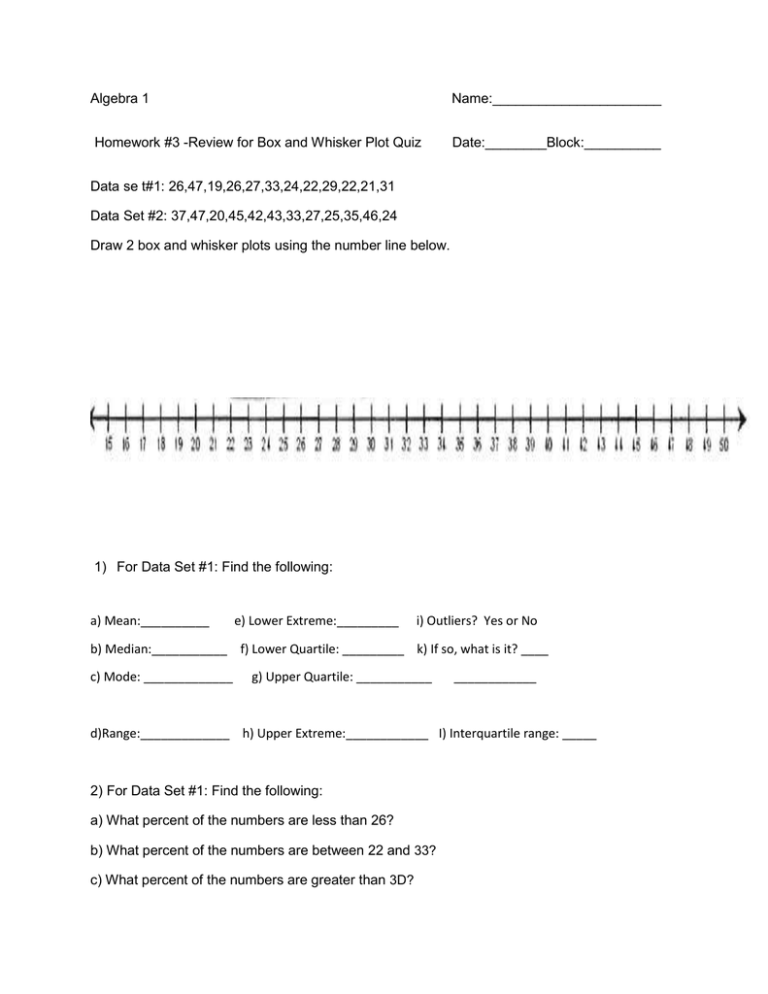
Algebra 1 Name:______________________ Homework #3 -Review for Box and Whisker Plot Quiz Date:________Block:__________ Data se t#1: 26,47,19,26,27,33,24,22,29,22,21,31 Data Set #2: 37,47,20,45,42,43,33,27,25,35,46,24 Draw 2 box and whisker plots using the number line below. 1) For Data Set #1: Find the following: a) Mean:__________ e) Lower Extreme:_________ i) Outliers? Yes or No b) Median:___________ f) Lower Quartile: _________ k) If so, what is it? ____ c) Mode: _____________ g) Upper Quartile: ___________ ____________ d)Range:_____________ h) Upper Extreme:____________ I) Interquartile range: _____ 2) For Data Set #1: Find the following: a) What percent of the numbers are less than 26? b) What percent of the numbers are between 22 and 33? c) What percent of the numbers are greater than 3D? 3) Looking at page 1 and the box and whisker plots, find the following: · In plot 1: a) How many numbers are less than 22? ____ b) How many numbers are less than 26? ___ In plot 2: c) How many numbers are between 26 and 44? d) How many numbers are greater than 26? Looking at both plots: e) How many numbers are greater than 26 ? f) How many numbers are less than 26 ? a) Median:__________ b) Lower Extreme:____ c) Outliers? Yes or No d) Lower Quartile: ______ e) Range ______ f) If so, what is it? ____ g) Upper Quartile: _____ h) Upper Extreme:____ I) Interquartile range: ____ J) If the number 9 was added to the data, what above would be MOST affected? ______ k) If the number 16 was added to the data, what above would be MOST affected?_____ l) If the number 24 was added to the data, what above would be MOST affected?_____ m) If the number 25 was added to the data, what would NOT be affected?_________ 1) Lower extreme 2) Upper extreme 3) Range 4) Upper quartile 5) Median


