DATA: Collect, Organize, and Interpret Tally Charts
advertisement
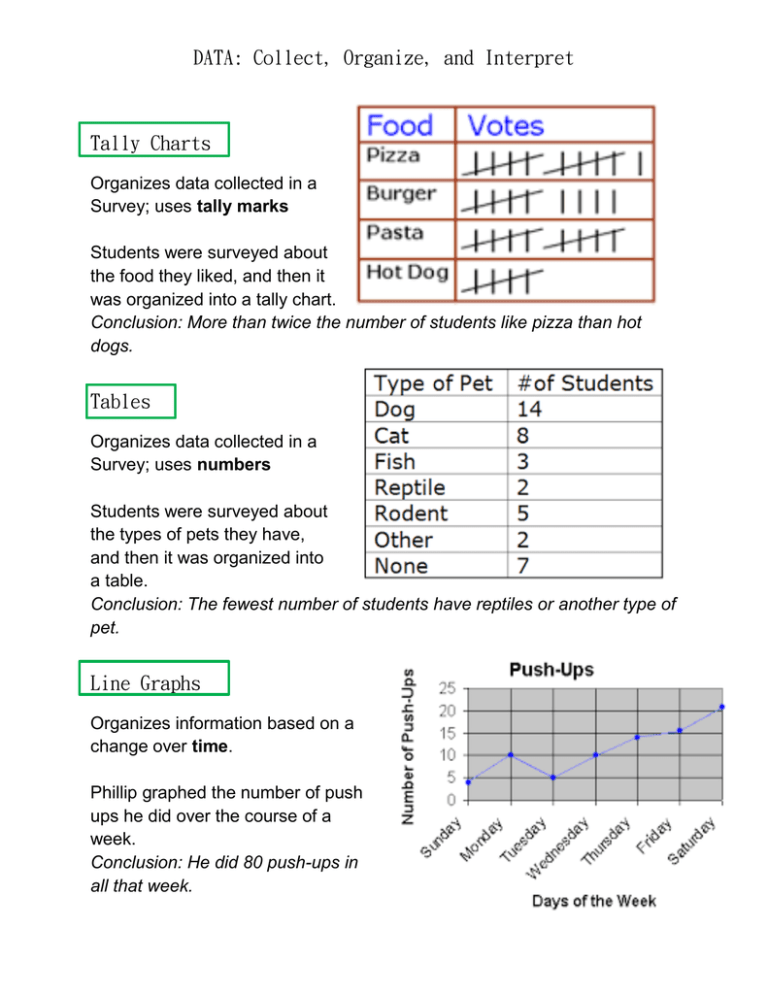
DATA: Collect, Organize, and Interpret Tally Charts Organizes data collected in a Survey; uses tally marks Students were surveyed about the food they liked, and then it was organized into a tally chart. Conclusion: More than twice the number of students like pizza than hot dogs. Tables Organizes data collected in a Survey; uses numbers Students were surveyed about the types of pets they have, and then it was organized into a table. Conclusion: The fewest number of students have reptiles or another type of pet. Line Graphs Organizes information based on a change over time. Phillip graphed the number of push ups he did over the course of a week. Conclusion: He did 80 push-ups in all that week. Stem and Leaf Plots A stem and leaf plot organizes numerical data from least to greatest. Stem= hundreds/tens place value Leaf= ones place value The stem and leaf plot represents the different grades from a science test: 72, 72, 74, 75, 76, 79, 81, 84, 85, 87, 87, 89, 90, 91, 93, 95, 98, 100, 100


