Regressions Workbook Answer Key
advertisement
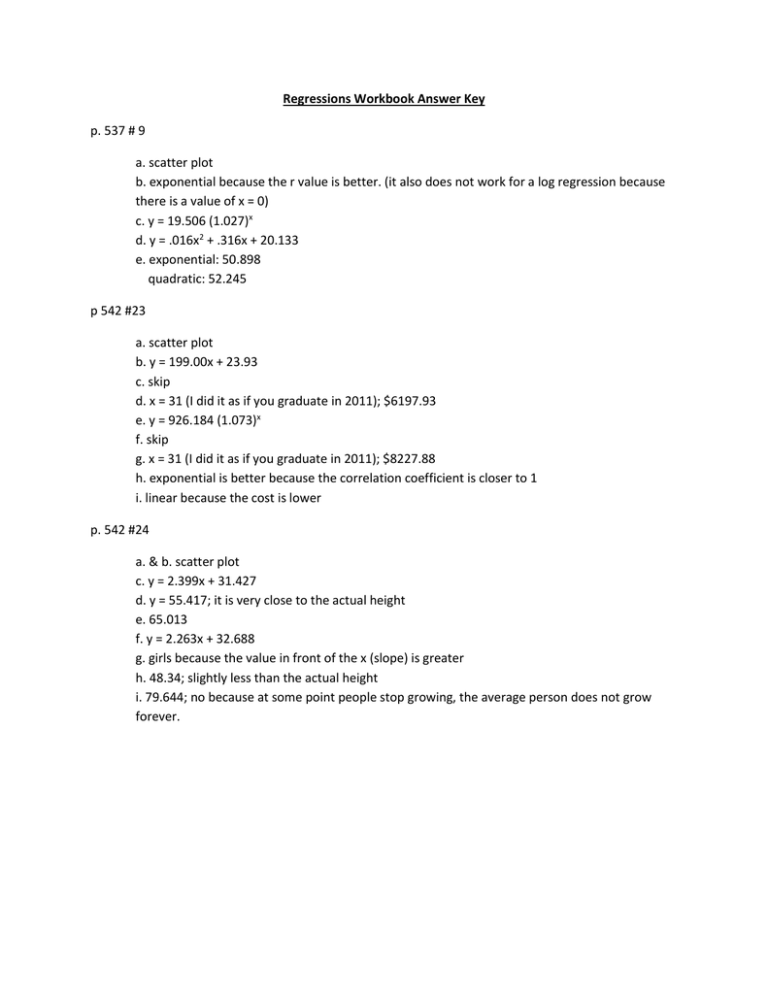
Regressions Workbook Answer Key p. 537 # 9 a. scatter plot b. exponential because the r value is better. (it also does not work for a log regression because there is a value of x = 0) c. y = 19.506 (1.027)x d. y = .016x2 + .316x + 20.133 e. exponential: 50.898 quadratic: 52.245 p 542 #23 a. scatter plot b. y = 199.00x + 23.93 c. skip d. x = 31 (I did it as if you graduate in 2011); $6197.93 e. y = 926.184 (1.073)x f. skip g. x = 31 (I did it as if you graduate in 2011); $8227.88 h. exponential is better because the correlation coefficient is closer to 1 i. linear because the cost is lower p. 542 #24 a. & b. scatter plot c. y = 2.399x + 31.427 d. y = 55.417; it is very close to the actual height e. 65.013 f. y = 2.263x + 32.688 g. girls because the value in front of the x (slope) is greater h. 48.34; slightly less than the actual height i. 79.644; no because at some point people stop growing, the average person does not grow forever.

