Graphing Practice #1
advertisement
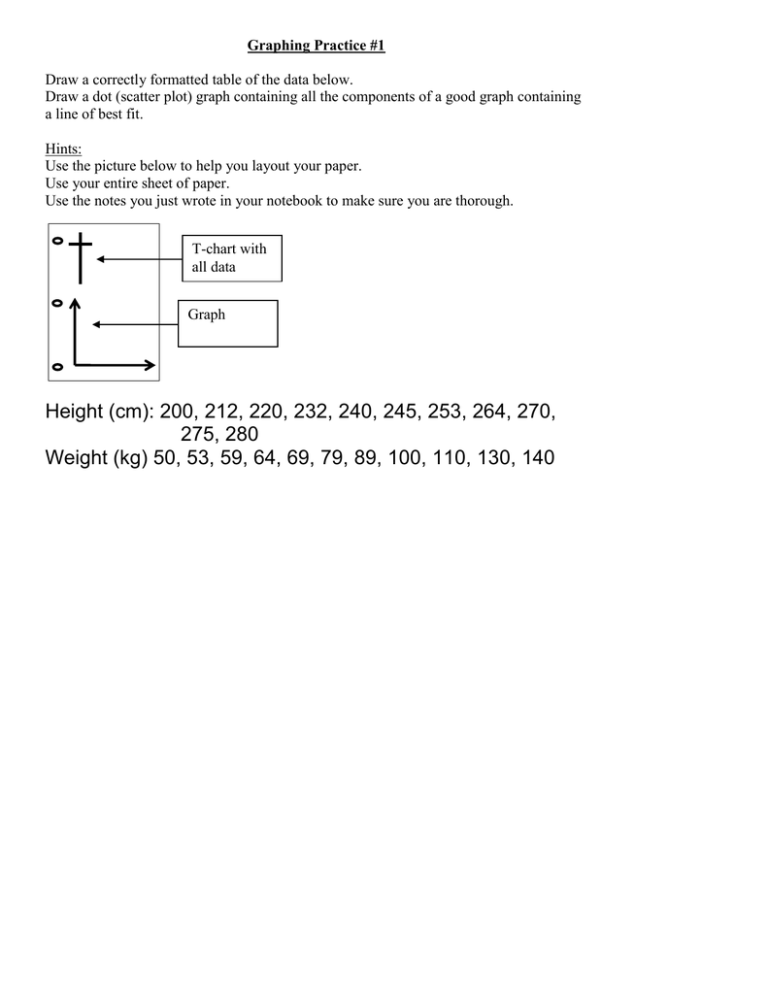
Graphing Practice #1 Draw a correctly formatted table of the data below. Draw a dot (scatter plot) graph containing all the components of a good graph containing a line of best fit. Hints: Use the picture below to help you layout your paper. Use your entire sheet of paper. Use the notes you just wrote in your notebook to make sure you are thorough. T-chart with all data Graph Height (cm): 200, 212, 220, 232, 240, 245, 253, 264, 270, 275, 280 Weight (kg) 50, 53, 59, 64, 69, 79, 89, 100, 110, 130, 140
