Name ____________________________________________ Date _____ Class _____ Homework: Control Charts
advertisement
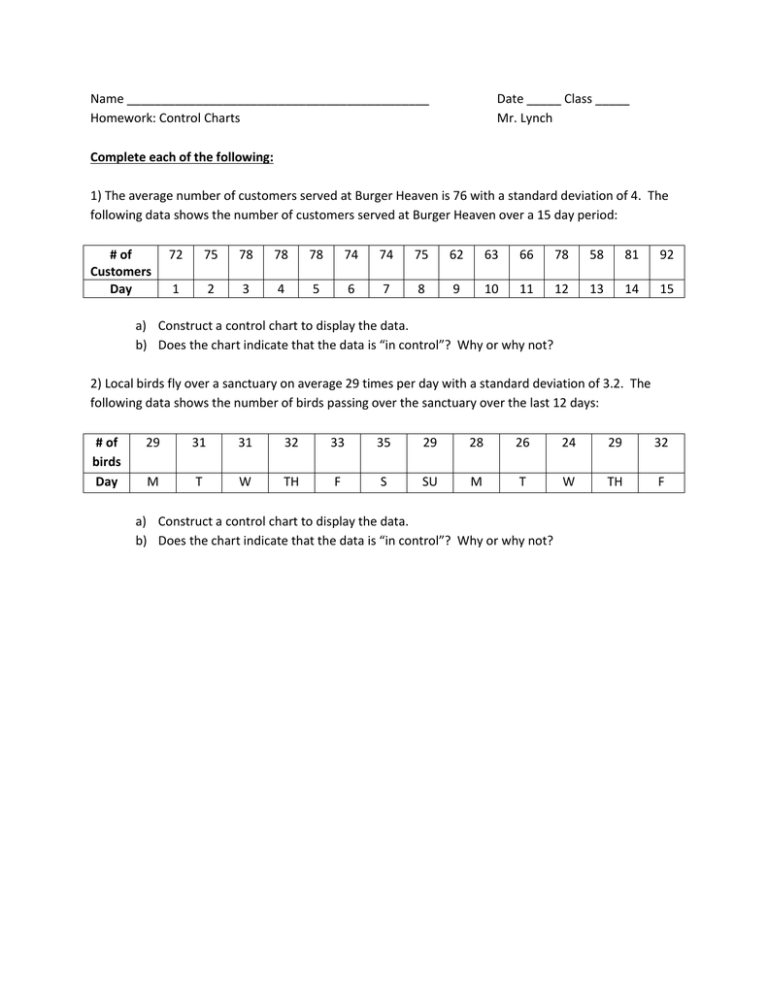
Name ____________________________________________ Homework: Control Charts Date _____ Class _____ Mr. Lynch Complete each of the following: 1) The average number of customers served at Burger Heaven is 76 with a standard deviation of 4. The following data shows the number of customers served at Burger Heaven over a 15 day period: # of Customers Day 72 75 78 78 78 74 74 75 62 63 66 78 58 81 92 1 2 3 4 5 6 7 8 9 10 11 12 13 14 15 a) Construct a control chart to display the data. b) Does the chart indicate that the data is “in control”? Why or why not? 2) Local birds fly over a sanctuary on average 29 times per day with a standard deviation of 3.2. The following data shows the number of birds passing over the sanctuary over the last 12 days: # of birds Day 29 31 31 32 33 35 29 28 26 24 29 32 M T W TH F S SU M T W TH F a) Construct a control chart to display the data. b) Does the chart indicate that the data is “in control”? Why or why not?


