Answers to Selected Exercises Answers for Chapter 6 1.
advertisement
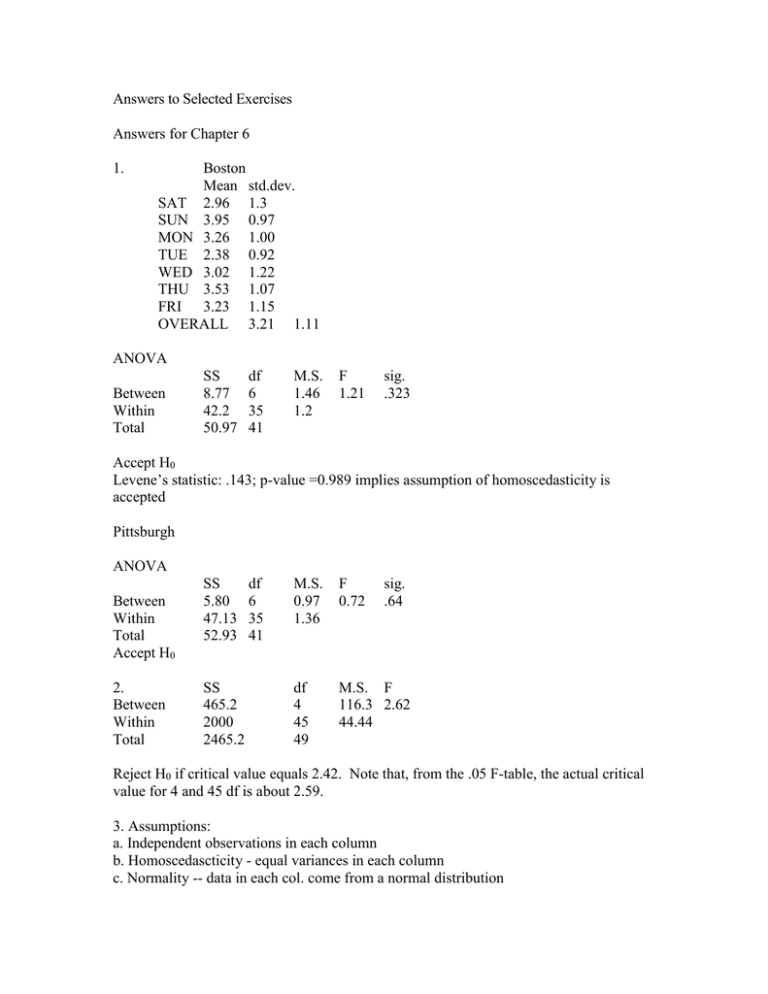
Answers to Selected Exercises Answers for Chapter 6 1. Boston Mean std.dev. SAT 2.96 1.3 SUN 3.95 0.97 MON 3.26 1.00 TUE 2.38 0.92 WED 3.02 1.22 THU 3.53 1.07 FRI 3.23 1.15 OVERALL 3.21 1.11 ANOVA Between Within Total SS 8.77 42.2 50.97 df 6 35 41 M.S. 1.46 1.2 F 1.21 sig. .323 Accept H0 Levene’s statistic: .143; p-value =0.989 implies assumption of homoscedasticity is accepted Pittsburgh ANOVA Between Within Total Accept H0 2. Between Within Total SS 5.80 47.13 52.93 SS 465.2 2000 2465.2 df 6 35 41 M.S. 0.97 1.36 F 0.72 sig. .64 df 4 45 49 M.S. F 116.3 2.62 44.44 Reject H0 if critical value equals 2.42. Note that, from the .05 F-table, the actual critical value for 4 and 45 df is about 2.59. 3. Assumptions: a. Independent observations in each column b. Homoscedascticity - equal variances in each column c. Normality -- data in each col. come from a normal distribution ANOVA is relatively robust with respect to assumptions b and c …this means that deviations from the assumptions will not drastically alter the results. Kruskal-Wallis test has more difficulty rejecting false hypotheses, in comparison with ANOVA. 4. Between Within Total SS 34.23 183.11 217.34 df 2 33 35 M.S. 17.115 5.549 F 3.084 Critical value is about 3.30, using alpha=0.05 and 2, 33 df. Accept H0. 5a. Within SS = 2205.69 5b. Test statistic = (181.49/2) / (2205.69/15). This is less than the critical value of 3.68 found from the table using 2 and 15 df, so the null hypothesis is not rejected. 6. The ratio 33.452/13.252 exceeds the critical value of 2.82, so reject the null hypothesis; the variances are unlikely to be the same. 7. Confidence intervals associated with a priori contrasts are narrower, and are therefore more powerful in rejecting null hypotheses that contrasts are equal to zero. This is because no adjustment has to be made for looking at the data after the analysis has been completed. 8. Between Within Total SS 6000 51013 57013 df 8 63 71 M.S. 750 809.7 F 0.93 Accept H0 Critical value from alpha=0.05 table is about 2.0 (not 2.8). p>0.05 9. Total SS = 24726.56; Within SS = 21787.33; Between SS = 2939.23 F = 1.82; critical value of F has 2 and 27 df, and is equal to 3.36. 11. Total SS = 481.28; Within SS = 425.70; Between SS = 55.58 Within df = 4f; Between df = 3 Within Mean Square = 9.675 Between Mean Square = 18.5267 F = 1.915 12. Within SS= 869.91; Between SS =193.97 F=3.34, which is greater than the critical value of 3.32 found from the table using 2 and 30 df. Reject the null hypothesis. 13. Within SS = 46.10 df = 37; Mean square = 1.246 Between SS = 10.06; df = 2; Mean square = 5.03 F = 4.037 Critical value of F with 2 and 37 df = 3.25 Reject null hypothesis


