transformed banana plants. Lanes 1-9: different transformed plants; lane 10:... pYC39 (positive control); lane 11: a wild-type control; lane 12:
advertisement
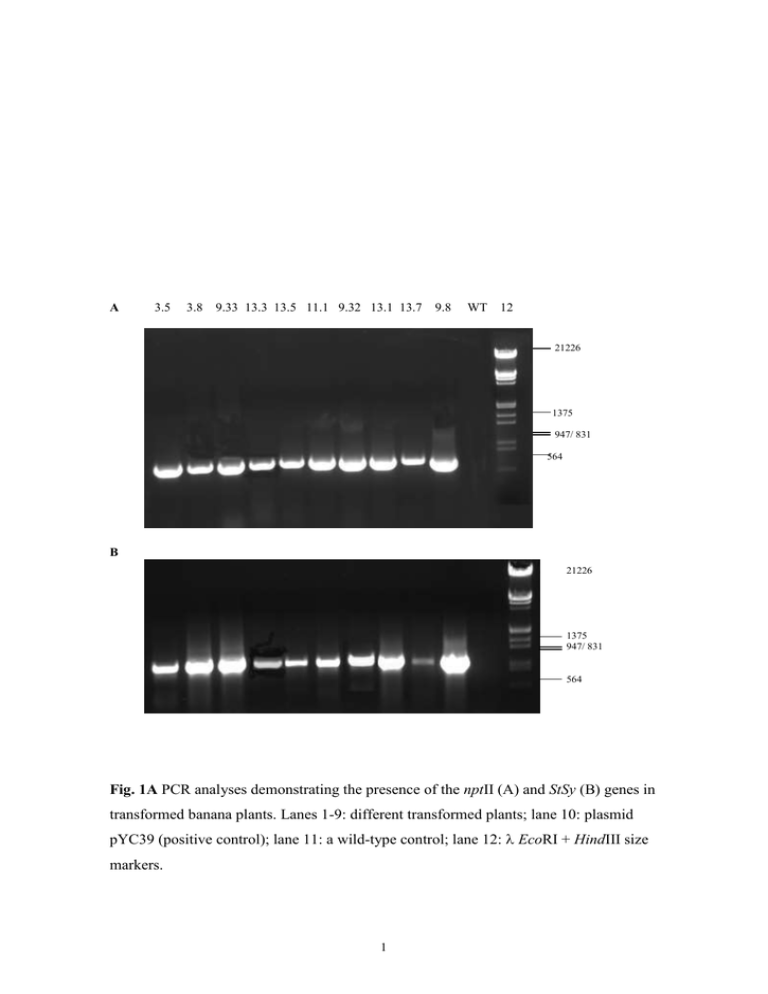
A 3.5 3.8 9.33 13.3 13.5 11.1 9.32 13.1 13.7 9.8 WT 12 21226 1375 947/ 831 564 B 21226 1375 947/ 831 564 Fig. 1A PCR analyses demonstrating the presence of the nptII (A) and StSy (B) genes in transformed banana plants. Lanes 1-9: different transformed plants; lane 10: plasmid pYC39 (positive control); lane 11: a wild-type control; lane 12: EcoRI + HindIII size markers. 1 Fig. 1B Southern hybridization analysis of DNA from five transformed banana plants. Genomic DNA was digested with HindIII. The membrane was hybridized with the 700bp nptII coding region. Con—non-transformed control plant. 2 Table 1 Germination of Botrytis cinerea conidia in transgenic banana leaf extracts Banana Germination Germ-tube length a line (%) (μm)a 13.1 23b 2.33b 9.33 14.8a 1.56a 11.3 28b 2.76b 11.6 24.4b 2.48b 11.1 27.4b 2.44b Control I 62c 6.52c Control II 59.4c 5.96cd a Values followed by the same letter are not significantly different at p 0.05, (Tukey, 1953) 3 Table 2 Botrytis cinerea leaf spot severity in different transgenic banana lines Exp 1 Banana line 9.33 13.1 13.7 9.3 11.3 11.4 11.6 11.4 11.1 3.8 31.1 33.2 Control LSD Exp 2 Banana line Incubation time (days) 8 14 18 6.3 7.1* 7.1* 8.8 12.1 12.1 5.3 11.4 12.1 2.5* 4.2* 3.3* 4.2* 5.4* 5.4* 5 9.2 8.7 2.5* 4.2* 4.2* 0* 11.7 11.7 0* 0* 0* 7.5 13.3 15 1.7* 1.7* 1.7* 6.4 11.3 14.2 9.8 8.7 9.2 0.36 0.92 0.95 9.33 13.1 13.7 9.3 11.3 11.4. 11.6 11.4 11.1 3.8 31.1 33.2 Control LSD Incubation time (days) 4 8 12 5* 14.2* 15* 15.8 17.5 20 10* 20 22.5 17.5 24.2 27.5 7.9* 15.8* 16.7* 13.8 15.8* 28.3 10.4* 29.2 57.1 13.8 15* 15.8* 0* 7.9* 8.3* 9.2* 15.8* 15.8* 7.9* 19.7 20.8 7.4* 16.2* 16.7* 13.3 18.3 21.7 1.2 1.4 1.9 * Significantly reduced disease severity as compared with the wild type control. 4 Table 3. Transgenic banana lines producing equal or greater number of flowers as compared to the conventional control 'Grand Nain'. TRANSGENIC LINE CODE FLOWERS PER 8 POSITIONS QTY. DIFFERENCE CONTROLS a + FACTOR DIFFERENCE CONTROLS % DIFFERENCE CONTROLS 9.32 11.8 9.8 9.33 3.5 11.1 3.8 13.1 13.5 13.3 8 10 7 10 6 12 6 5 5 8 +3 +5 +2 +5 +1 +7 +1 0 0 +3 1.6 2.0 1.4 2.0 1.2 2.4 1.2 0.0 0.0 1.6 + 60 % + 100%* + 40% + 100%* +20% +140%* + 20% 0% 0% + 60% * Flower numbers are statistically greater than the controls; least square means of 5 flowers from 8 plants per line compared using Fisher’s protected least significant difference (FLSD) a Number of flowers equal to or greater than the controls 5
