Project 3 - Due 11/14/11
advertisement
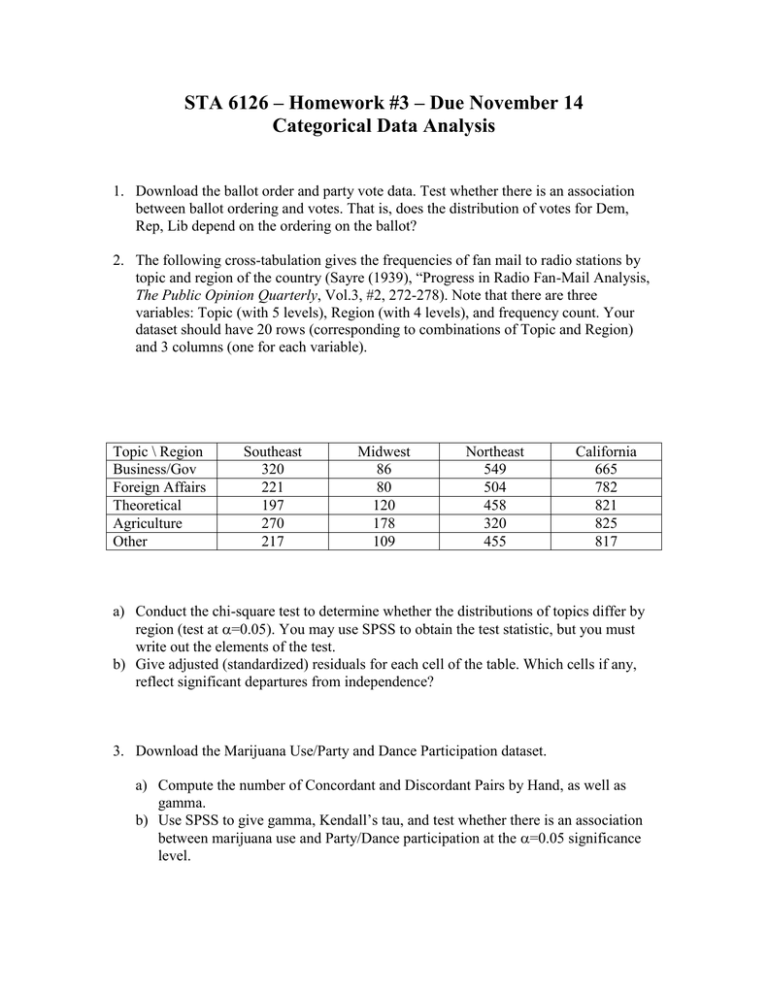
STA 6126 – Homework #3 – Due November 14 Categorical Data Analysis 1. Download the ballot order and party vote data. Test whether there is an association between ballot ordering and votes. That is, does the distribution of votes for Dem, Rep, Lib depend on the ordering on the ballot? 2. The following cross-tabulation gives the frequencies of fan mail to radio stations by topic and region of the country (Sayre (1939), “Progress in Radio Fan-Mail Analysis, The Public Opinion Quarterly, Vol.3, #2, 272-278). Note that there are three variables: Topic (with 5 levels), Region (with 4 levels), and frequency count. Your dataset should have 20 rows (corresponding to combinations of Topic and Region) and 3 columns (one for each variable). Topic \ Region Business/Gov Foreign Affairs Theoretical Agriculture Other Southeast 320 221 197 270 217 Midwest 86 80 120 178 109 Northeast 549 504 458 320 455 California 665 782 821 825 817 a) Conduct the chi-square test to determine whether the distributions of topics differ by region (test at =0.05). You may use SPSS to obtain the test statistic, but you must write out the elements of the test. b) Give adjusted (standardized) residuals for each cell of the table. Which cells if any, reflect significant departures from independence? 3. Download the Marijuana Use/Party and Dance Participation dataset. a) Compute the number of Concordant and Discordant Pairs by Hand, as well as gamma. b) Use SPSS to give gamma, Kendall’s tau, and test whether there is an association between marijuana use and Party/Dance participation at the =0.05 significance level.
