Name: ________________________________ Date: __________________ Period: ________ T D S
advertisement
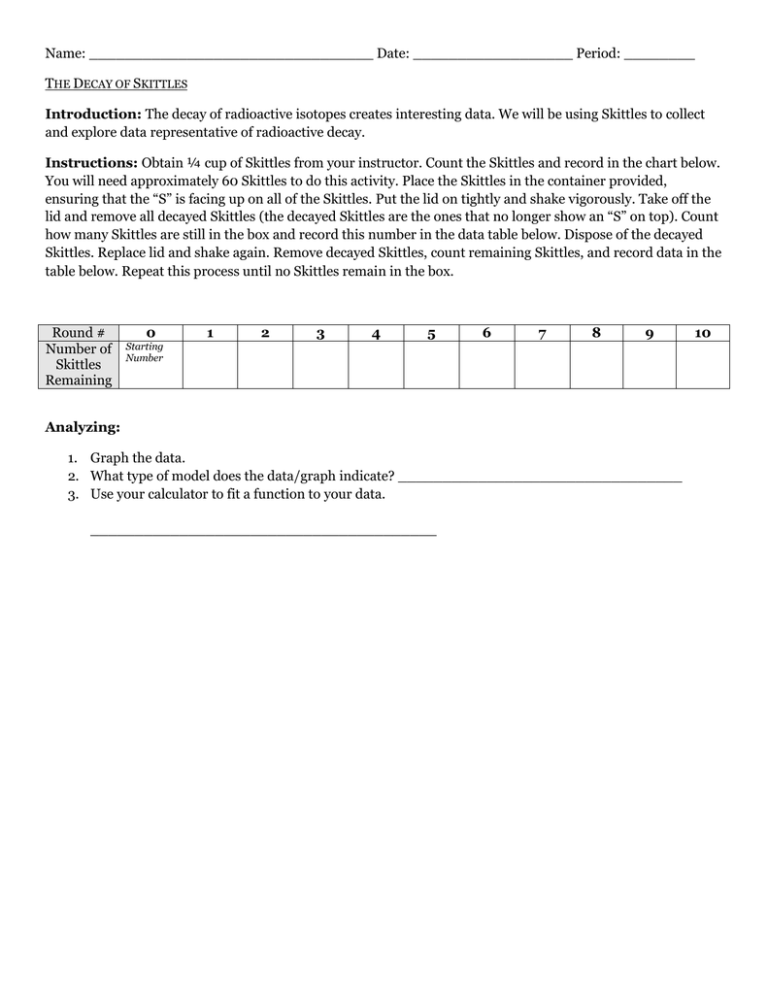
Name: ________________________________ Date: __________________ Period: ________ THE DECAY OF SKITTLES Introduction: The decay of radioactive isotopes creates interesting data. We will be using Skittles to collect and explore data representative of radioactive decay. Instructions: Obtain ¼ cup of Skittles from your instructor. Count the Skittles and record in the chart below. You will need approximately 60 Skittles to do this activity. Place the Skittles in the container provided, ensuring that the “S” is facing up on all of the Skittles. Put the lid on tightly and shake vigorously. Take off the lid and remove all decayed Skittles (the decayed Skittles are the ones that no longer show an “S” on top). Count how many Skittles are still in the box and record this number in the data table below. Dispose of the decayed Skittles. Replace lid and shake again. Remove decayed Skittles, count remaining Skittles, and record data in the table below. Repeat this process until no Skittles remain in the box. Round # Number of Skittles Remaining 0 1 2 3 4 5 6 7 8 9 Starting Number Analyzing: 1. Graph the data. 2. What type of model does the data/graph indicate? ________________________________ 3. Use your calculator to fit a function to your data. _______________________________________ 10
