Name: Date: Period: ____ CHS Statistics Chi
advertisement
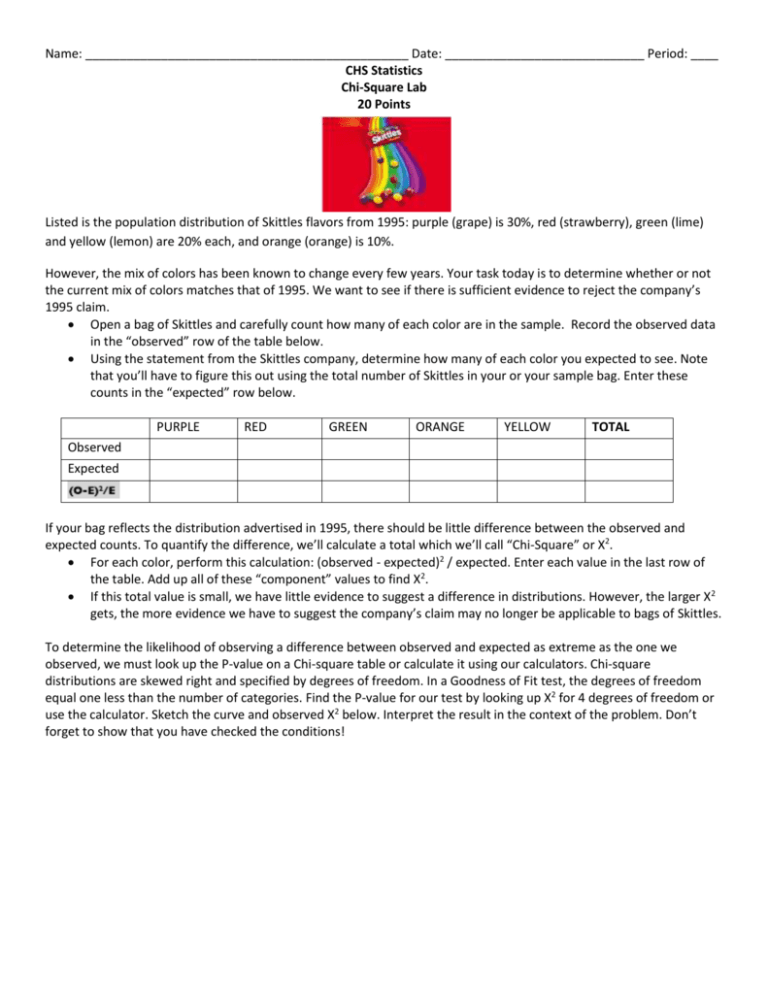
Name: _______________________________________________ Date: _____________________________ Period: ____ CHS Statistics Chi-Square Lab 20 Points Listed is the population distribution of Skittles flavors from 1995: purple (grape) is 30%, red (strawberry), green (lime) and yellow (lemon) are 20% each, and orange (orange) is 10%. However, the mix of colors has been known to change every few years. Your task today is to determine whether or not the current mix of colors matches that of 1995. We want to see if there is sufficient evidence to reject the company’s 1995 claim. Open a bag of Skittles and carefully count how many of each color are in the sample. Record the observed data in the “observed” row of the table below. Using the statement from the Skittles company, determine how many of each color you expected to see. Note that you’ll have to figure this out using the total number of Skittles in your or your sample bag. Enter these counts in the “expected” row below. PURPLE RED GREEN ORANGE YELLOW TOTAL Observed Expected If your bag reflects the distribution advertised in 1995, there should be little difference between the observed and expected counts. To quantify the difference, we’ll calculate a total which we’ll call “Chi-Square” or X2. For each color, perform this calculation: (observed - expected)2 / expected. Enter each value in the last row of the table. Add up all of these “component” values to find X2. If this total value is small, we have little evidence to suggest a difference in distributions. However, the larger X2 gets, the more evidence we have to suggest the company’s claim may no longer be applicable to bags of Skittles. To determine the likelihood of observing a difference between observed and expected as extreme as the one we observed, we must look up the P-value on a Chi-square table or calculate it using our calculators. Chi-square distributions are skewed right and specified by degrees of freedom. In a Goodness of Fit test, the degrees of freedom equal one less than the number of categories. Find the P-value for our test by looking up X2 for 4 degrees of freedom or use the calculator. Sketch the curve and observed X2 below. Interpret the result in the context of the problem. Don’t forget to show that you have checked the conditions!
