CAMP Graph Stations
advertisement
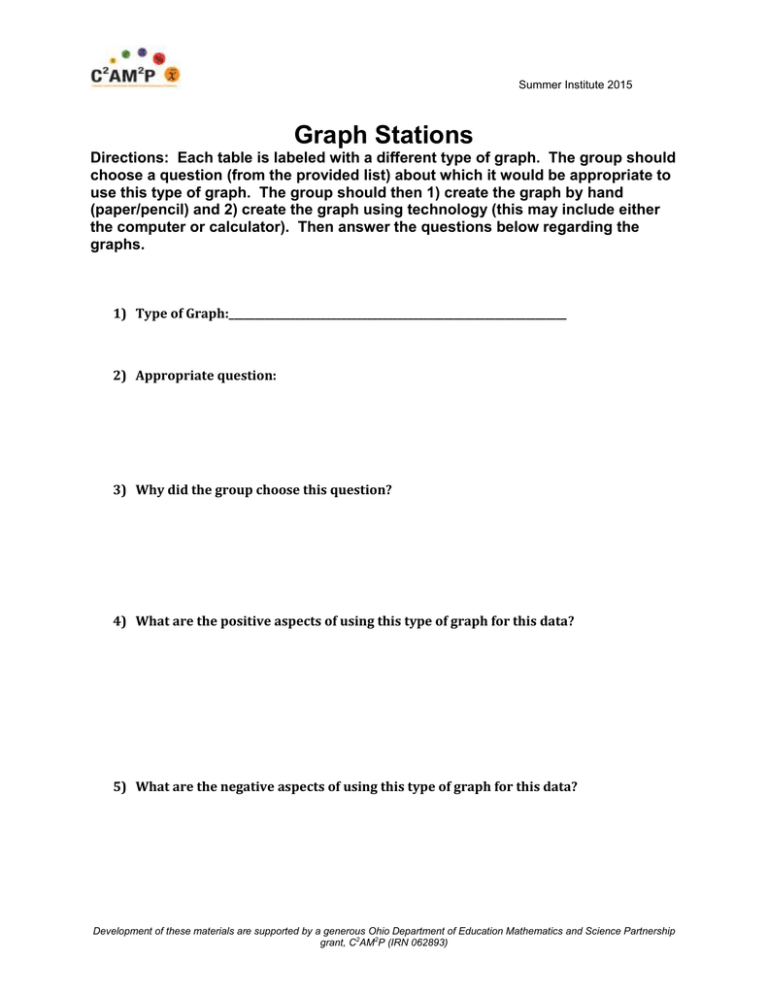
Summer Institute 2015 Graph Stations Directions: Each table is labeled with a different type of graph. The group should choose a question (from the provided list) about which it would be appropriate to use this type of graph. The group should then 1) create the graph by hand (paper/pencil) and 2) create the graph using technology (this may include either the computer or calculator). Then answer the questions below regarding the graphs. 1) Type of Graph:__________________________________________________________________ 2) Appropriate question: 3) Why did the group choose this question? 4) What are the positive aspects of using this type of graph for this data? 5) What are the negative aspects of using this type of graph for this data? Development of these materials are supported by a generous Ohio Department of Education Mathematics and Science Partnership grant, C2AM2P (IRN 062893) Summer Institute 2015 6) What are some positive/negative aspects of making this graph by hand? 7) What are some positive/negative aspects of making this graph using technology? 8) Another type of graph that would have been appropriate would have been: 9) We did not choose this type of graph because: Development of these materials are supported by a generous Ohio Department of Education Mathematics and Science Partnership grant, C2AM2P (IRN 062893)
