C H A P T E R T IT L E
advertisement
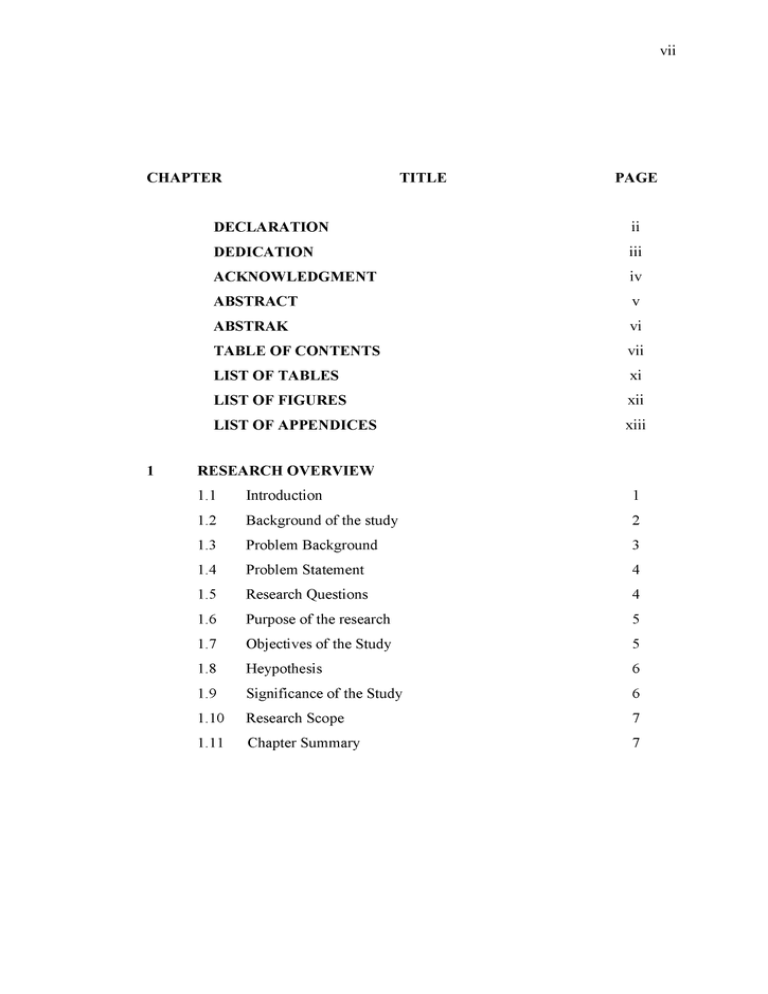
v ii C H A PTE R 1 T IT L E PAGE D ECLA RA TIO N ii D ED ICA TIO N iii A C K N O W LED G M EN T iv ABSTRA CT v ABSTRAK vi TABLE O F C O NTEN TS vii LIST O F TABLES xi LIST O F FIG U R ES xii LIST O F A PPEN D IC ES xiii R ESEA R C H O V ERV IEW 1.1 Introduction 1 1.2 Background of the study 2 1.3 Problem Background 3 1.4 Problem Statement 4 1.5 Research Questions 4 1.6 Purpose of the research 5 1.7 Objectives of the Study 5 1.8 Heypothesis 6 1.9 Significance of the Study 6 1.10 Research Scope 7 1.11 Chapter Summary 7 v iii 2 LITERATURE REVIEW 2.1 2.2 Introduction 8 2.1.1 9 Types of distance learning 2.1.1.1 Synchronous DistanceLearning 9 2.1.1.2 Asynchronous Distance Learning 9 Background of virtual learning environment 10 2.2.1 Definition of virtual learning environment 12 2.2.2 VLE vs. Traditional Learning 13 2.2.3 Advantage and Disadvantages of VLE 17 2.2.3.1 Advantages of VLE 17 2.2.3.2 Disadvantage of VLE 20 2.2.4 Challenges o f Virtual Learning Environment 21 2.2.5 Features of Virtual Learning Environment 22 2.2.6 Virtual Learning Environment Technology 25 2.3 Virtual Learning Environment and pedagogy 27 2.4 Evaluation o f Virtual Learning Environment 29 2.4.1 VLE Evaluation and History 29 2.4.2 Evaluation VLE in Education 34 2.4.3 Evaluation VLE in Higher Education 36 2.5 2.6 Comparing Theories in VLE 39 2.5.1 Technology Acceptance Model (TAM) 39 2.5.2 Theory of Reasoned Action (TRA) Model 40 2.5.3 Social Cognitive Theory (CST) Model 41 2.5.4 Technology Readiness Index (TRI) Model 43 2.5.5 Researrch Model 44 Chapter Summary 46 v iii 3 4 R ESEA R C H M ETH O D O LO TY 3.1 Introduction 47 3.2 Research Design 48 3.3 Research Design Discussion 50 3.4 Data coll ection 51 3.4.1 Secondary Data Collection 51 3.4.2 Prim ary D ata C ollection 51 3.5 Population and Sampling 52 3.6 Research Instruments 54 3.6.1 The development of the instrument 54 3.6.2 Questionnaire 55 3.6.3 Personal Details (Demographic Data) 55 3.6.4 Optimism 55 3.6.5 Innovativeness 56 3.6.6 Discomfort 56 3.6.7 Insecurity 57 3.6.8 VLE Readiness 57 3.6.9 Measurement items in the research 57 3.7 Data Analysis 59 3.8 Chapter Summary 60 R ESEA R C H FINDINGS 4.1 Introduction 63 4.2 Data collection 62 4.2.1 62 Questionnaire Analysis 4.3 Reliability Analysis 63 4.4 Validity Analysis 64 4.5 Descriptive Analysis 66 4.5.1 Gender 66 4.5.2 Age groups 67 4.5.3 Faculties 69 4.5.4 Level of study 70 4.5.5 Technology Readiness Index (TRI) Score 71 IX 4.6 5 Linear Regression Analysis 73 4.6.1 Student’s Optimism and VLE readiness 74 4.6.2 Innovativeness and VLE readiness 75 4.6.3 Discomfort and VLE readiness 76 4.6.4 Insecurity and VLE readiness 77 4.7 Hypothesis Test and Relationship 78 4.8 Model Description 79 4.19 Summary 80 4.10 Chapter Summary 81 D ISC U SSIO N AND C O N C L U SIO N 5.1 Introduction 82 5.2 Overall Discussion 83 5.3 Objectives Accomplishments 84 5.4 Achievements 87 5.5 Research Constraints 88 5.6 Aspirations 89 5.7 Future Works 89 5.8 Recommendations and Conclusions 90 5.9 Chapter Summary 91 REFFEREN CE 92 A PPEN D IX 97 Xi LIST O F TABLES TA BLE NO T IT L E PA G E 2.1 Comparison of VLE and Traditional Learning 14 2.2 SWOT Analysis 16 3.3 History of Virtual Learning Environment 30 3.1 Sample Determination Table 53 3.2 Instruments of the Research 58 4.1 Cronbach’s alpha (Reliability) 63 4.2 Factor loadings for the rotated factors 65 4.3 Technology Readiness IndeX score 71 4.4 Summary of the TRI dimensions 73 4.5 Regression Result for (H1) 74 4.7 Regression Result for (H2) 75 4.7 Regression Result for(H3) 76 4.8 Regression Result for (H4) 77 4.9 Summary for Hypotheses Testing 78 xill LIST O F FIG U R ES FIG U R E NO T IT L E PAGE 2.1 Technology Acceptance Model(TAM) 40 2.2 Theory of Reasoned Action(TRA) 41 2.3 Social cognitive theories (SCT1) 42 2.4 Social Cognitive Theory (SCT2) 42 2.5 Technology Readiness Index (TRI) 44 2.6 Research Model 45 3.1 Research Design 49 4.1 Respondents by Gender 67 4.2 Percentages of participants by age group 68 43 Percentage of participants by faculty 69 4.4 Percentage participants by level of study 70 4.5 Technology Readiness Index (TRI) score 72 4.6 Results for Regression Analysis 79
