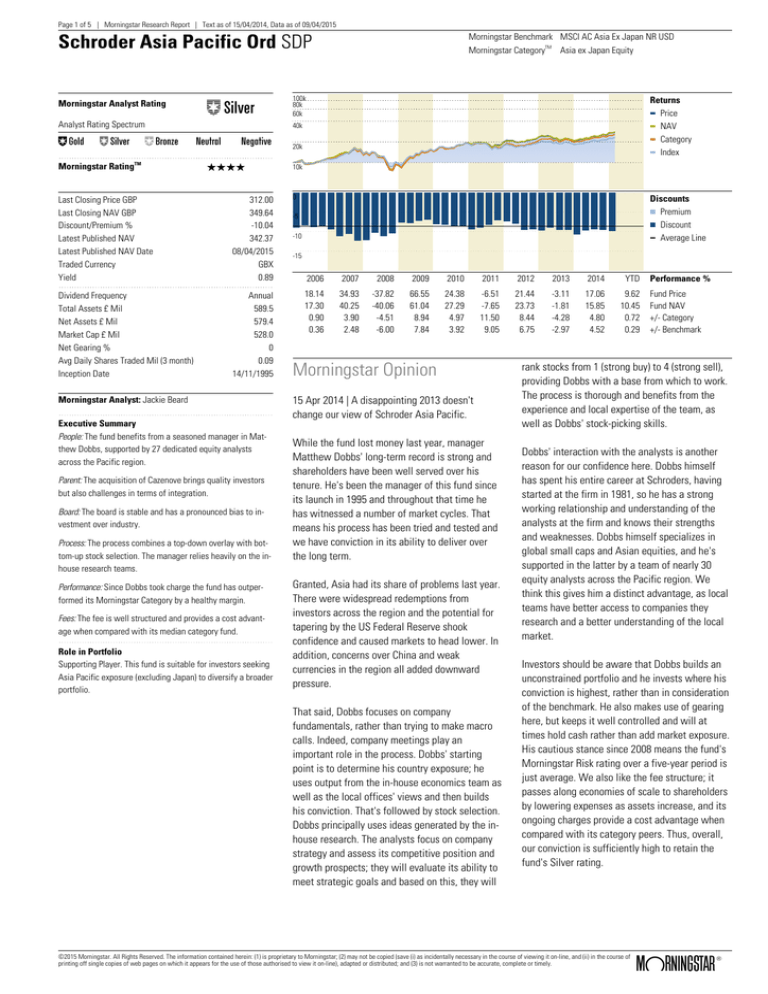
Page 1 of 5 | Morningstar Research Report | Text as of 15/04/2014, Data as of 09/04/2015
Morningstar Benchmark MSCI AC Asia Ex Japan NR USD
Schroder Asia Pacific Ord SDP
Morningstar Analyst Rating
„
Analyst Rating Spectrum
Œ
„
´
Morningstar RatingTM
Last Closing Price GBP
Last Closing NAV GBP
Discount/Premium %
Latest Published NAV
Latest Published NAV Date
Traded Currency
Yield
Dividend Frequency
Total Assets £ Mil
Net Assets £ Mil
Market Cap £ Mil
Net Gearing %
Avg Daily Shares Traded Mil (3 month)
Inception Date
Morningstar CategoryTM Asia ex Japan Equity
100k
80k
60k
Returns
Price
NAV
Category
Index
40k
‰
Á
QQQQ
312.00
349.64
-10.04
342.37
08/04/2015
GBX
0.89
Annual
589.5
579.4
528.0
0
0.09
14/11/1995
Morningstar Analyst: Jackie Beard
Executive Summary
People: The fund benefits from a seasoned manager in Matthew Dobbs, supported by 27 dedicated equity analysts
across the Pacific region.
Parent: The acquisition of Cazenove brings quality investors
but also challenges in terms of integration.
Board: The board is stable and has a pronounced bias to investment over industry.
Process: The process combines a top-down overlay with bottom-up stock selection. The manager relies heavily on the inhouse research teams.
Performance: Since Dobbs took charge the fund has outperformed its Morningstar Category by a healthy margin.
Fees: The fee is well structured and provides a cost advantage when compared with its median category fund.
Role in Portfolio
Supporting Player. This fund is suitable for investors seeking
Asia Pacific exposure (excluding Japan) to diversify a broader
portfolio.
20k
10k
4k
0
Discounts
Premium
Discount
Average Line
-5
-10
-15
-20
2006
2007
2008
2009
2010
2011
2012
2013
2014
YTD
18.14
17.30
0.90
0.36
34.93
40.25
3.90
2.48
-37.82
-40.06
-4.51
-6.00
66.55
61.04
8.94
7.84
24.38
27.29
4.97
3.92
-6.51
-7.65
11.50
9.05
21.44
23.73
8.44
6.75
-3.11
-1.81
-4.28
-2.97
17.06
15.85
4.80
4.52
9.62
10.45
0.72
0.29
Morningstar Opinion
15 Apr 2014 | A disappointing 2013 doesn't
change our view of Schroder Asia Pacific.
While the fund lost money last year, manager
Matthew Dobbs' long-term record is strong and
shareholders have been well served over his
tenure. He's been the manager of this fund since
its launch in 1995 and throughout that time he
has witnessed a number of market cycles. That
means his process has been tried and tested and
we have conviction in its ability to deliver over
the long term. Granted, Asia had its share of problems last year.
There were widespread redemptions from
investors across the region and the potential for
tapering by the US Federal Reserve shook
confidence and caused markets to head lower. In
addition, concerns over China and weak
currencies in the region all added downward
pressure. That said, Dobbs focuses on company
fundamentals, rather than trying to make macro
calls. Indeed, company meetings play an
important role in the process. Dobbs' starting
point is to determine his country exposure; he
uses output from the in-house economics team as
well as the local offices' views and then builds
his conviction. That's followed by stock selection.
Dobbs principally uses ideas generated by the inhouse research. The analysts focus on company
strategy and assess its competitive position and
growth prospects; they will evaluate its ability to
meet strategic goals and based on this, they will
Performance %
Fund Price
Fund NAV
+/- Category
+/- Benchmark
rank stocks from 1 (strong buy) to 4 (strong sell),
providing Dobbs with a base from which to work.
The process is thorough and benefits from the
experience and local expertise of the team, as
well as Dobbs' stock-picking skills.
Dobbs' interaction with the analysts is another
reason for our confidence here. Dobbs himself
has spent his entire career at Schroders, having
started at the firm in 1981, so he has a strong
working relationship and understanding of the
analysts at the firm and knows their strengths
and weaknesses. Dobbs himself specializes in
global small caps and Asian equities, and he's
supported in the latter by a team of nearly 30
equity analysts across the Pacific region. We
think this gives him a distinct advantage, as local
teams have better access to companies they
research and a better understanding of the local
market.
Investors should be aware that Dobbs builds an
unconstrained portfolio and he invests where his
conviction is highest, rather than in consideration
of the benchmark. He also makes use of gearing
here, but keeps it well controlled and will at
times hold cash rather than add market exposure.
His cautious stance since 2008 means the fund's
Morningstar Risk rating over a five-year period is
just average. We also like the fee structure; it
passes along economies of scale to shareholders
by lowering expenses as assets increase, and its
ongoing charges provide a cost advantage when
compared with its category peers. Thus, overall,
our conviction is sufficiently high to retain the
fund's Silver rating.
©2015 Morningstar. All Rights Reserved. The information contained herein: (1) is proprietary to Morningstar; (2) may not be copied (save (i) as incidentally necessary in the course of viewing it on-line, and (ii) in the course of
printing off single copies of web pages on which it appears for the use of those authorised to view it on-line), adapted or distributed; and (3) is not warranted to be accurate, complete or timely.
®
ß
Page 2 of 5 | Morningstar Research Report | Text as of 15/04/2014, Data as of 09/04/2015
Schroder Asia Pacific Ord SDP
People
Manager
Manager Start
Matthew Dobbs
20/11/1995
Avg. Manager Tenure
19.4 Years
Other Funds Managed
Schroder Oriental Income Ord, Schroder Asian Alpha Plus A
Acc, Schroder ISF Global Smaller Comp A Acc, Transamerica
International Small Cap I2
Parent
Fund Advisor
Domicile
Website
Schroder Investment
Management Ltd
UK
http://www.schroders.com/uks
apf/home/
Board of Directors
Discount Target
Tender Offer
Buyback Authorization
10% over the
longer term
Yes
Yes
Morningstar Benchmark MSCI AC Asia Ex Japan NR USD
Morningstar CategoryTM Asia ex Japan Equity
This fund benefits from an extensive team of local portfolio managers and analysts led by a highly
experienced manager in Matthew Dobbs. Dobbs
has more than three decades of investing experience and has spent his entire career at Schroders. He joined the firm in 1981 as an investment analyst and became a portfolio manager
four years later. He joined the global small-cap
team in 1996 and started running Asian small-cap
portfolios from that date. In 2000, he was appointed head of global small-cap equities, and he's
also part of the Asian Specialist team. Dobbs
oversees four regional teams together with
Richard Sennitt, with whom he comanages his
global funds. In addition to this offering, he runs a
number of other funds, some of which are global
small-cap funds and others are higher up the cap
scale and focused on Asia ex-Japan. He is supported by nearly 30 dedicated equity analysts
across the Pacific region, with an average investment experience exceeding 15 years, covering
larger-cap stocks. The analysts are located in
Schroders' offices in Hong Kong, Singapore,
Seoul, Shanghai, Sydney, and Taipei, which
brings local expertise and an understanding of
cultural nuances.
Schroders has benefited from stable ownership
since it was founded more than 200 years ago
and the Schroder family still holds nearly half of
the company's listed shares. At 30 Sept 2013, following completion of the Cazenove acquisition,
the company's assets under management surpassed GBP 250 billion. Schroders' current
strength lies in its equity funds. The firm also
manages fixed income, alternatives, and multi-asset funds; the acquisition of Cazenove Capital
helps to extend the product range further, particularly within the pan-European equities, fixed income and multi-manager investment areas.
Cazenove, like Schroders, is focussed on asset
management and the acquisition brought some
quality fund managers, such as Julie Dean, to the
firm; that said, the two companies are yet to be
fully integrated, which might result in a potential
product rationalisation. We also have seen some
departure from Cazenove following the acquisition. On a positive note Schroders has become in
recent times more adept at managing capacity issues with some of its more popular funds, where
previously it had over-marketed already hot-performing products. Fund managers' remuneration
is based on the performance of their funds over
one- and three-year periods and generally more
weight is placed on three-year returns, but there
are teams, such as GEM, that put more emphasis
on one-year results.
The board numbers five non-executive directors
with an average tenure of more than nine years.
The current chairman, the Hon Rupert Carington,
is the longest-serving member; he was appointed
as chairman of the board in Sept 1995, and thus
he has served in this role for more than 18 years.
The most recent change to the board was in June
2013, when Robert Boyle resigned, but this was
preceded by the appointment of a new
director—Rosemary Morgan--in mid-2012. Although the average tenure of board members is
long, the current mix comprises a good balance
between long-standing directors and more recent
joiners, which should help to maintain continuity
and also keep a fresh perspective. The majority of
the board bring extensive investment management experience rather than industry careers;
four of them have spent time working in Asia and
Robert Binyon is still based in Thailand. Binyon is
chairman of a corporate finance firm in Thailand
that operates throughout the region, thus he
brings an excellent insight into corporate behaviour. All directors are shareholders in the fund,
which we like to see, as we believe it aligns their
interests with those of their shareholders. Four of
the five directors have seats on the boards of other listed companies. The board meets formally
five times a year, which includes a dedicated
strategy meeting.
©2015 Morningstar. All Rights Reserved. The information contained herein: (1) is proprietary to Morningstar; (2) may not be copied (save (i) as incidentally necessary in the course of viewing it on-line, and (ii) in the course of
printing off single copies of web pages on which it appears for the use of those authorised to view it on-line), adapted or distributed; and (3) is not warranted to be accurate, complete or timely.
®
ß
Page 3 of 5 | Morningstar Research Report | Text as of 15/04/2014, Data as of 09/04/2015
Morningstar Benchmark MSCI AC Asia Ex Japan NR USD
Schroder Asia Pacific Ord SDP
Process: Investment Approach
Investment Objective: To achieve capital growth by investing
in equities of companies in Asia, (excluding the Middle East
and Japan) and the Far Eastern countries bordering the
Pacific Ocean.
No Holdings Range
Max Position Size
Min Position Size
Expd Turnover
Sector Constraints
Hedging Policy
Tactical Use of Cash
70-80
None
None
Approximately 100%
None
Unhedged
Yes
Process: Portfolio Positioning
Morningstar Holdings Based Style Map
Giant
Large
Mid
Small
Micro
Deep Core Core Core High
Val Val
Grw Grw
World Regions
Dobbs follows a bottom-up process with a topdown overlay. He determines country allocations
using Schroders' central economics team research, the views from the local offices, and by
talking to his contacts. Stock selection is based
principally on ideas generated by Schroders' analysts, but Dobbs also uses his extensive network
of contacts. Fundamental analysis combined with
company meetings is the foundation of the analysts' research. They focus on company strategy
and assess both its competitive position and
growth prospects. Their evaluations include historic and prospective earnings growth, quality of
earnings, competitive position, barriers to entry,
and focus on shareholder value. Based on these
factors, they will compile cash flow and earnings
estimates to evaluate the company's ability to
meet its strategic goals. Following this research,
analysts generate a recommendation for each
stock, on a rating scale of 1 (strong buy) to 4
(strong sell). Dobbs focuses mainly on stocks
rated 1 and 2; however, he's not excluded from
holding a stock ranked 3 if its investment case
fits his needs. Dobbs likes to see earnings growth
potential and sustainable returns in his companies. Turnover is fairly high and hovers around
100% per annum. The portfolio will typically consist of between 70 and 80 of the best ideas in the
region.
The fund is unconstrained, which is reflected both
in its country and sector exposures when compared with its Morningstar Category peers and its
index. Indeed, at 31 Oct, the fund was considerably overweight in Hong Kong and underweight in
China and, to a lesser extent, Taiwan. At a sector
level, the fund was overweight consumer discretionary and industrials and the manager has been
closing the underweight in financials, but more
through REITs than banks. Where valuations have
been hit hard, Dobbs has been topping up or introducing new holdings--examples include China
Petroleum and Sinopec. He has become less negative on Chinese health-care names and bought
Mindray. He has also taken technology from an
underweight to an overweight, adding Tencent
and topping up Baidu. That said, turnover remains low, in keeping with Dobbs' investment approach.
Asset Allocation
Sector Weightings
Assets %
Greater Europe
0.40
United Kingdom
Europe-Developed
Europe-Emerging
Africa/Middle East
0.00
0.40
0.00
0.00
Americas
1.65
North America
Latin America
1.65
0.00
Greater Asia
97.95
Japan
Australasia
Asia-Developed
Asia-Emerging
0.00
1.04
48.96
47.94
Not Classified
Morningstar CategoryTM Asia ex Japan Equity
0.00
-100 -50
0
% Assets
Long
Short
Net
Cash
Equity
Bond
Other
0.0
99.6
0.0
0.4
0.0
0.0
0.0
0.0
0.0
99.6
0.0
0.4
50 100
Top 10 Holdings 30/11/2014
Taiwan Semiconductor Manufacturing
Jardine Strategic Holdings Ltd
Samsung Electronics Co Ltd
Fortune Real Estate Investment Trus
AIA Group Ltd
Hyundai Motor Co
China Petroleum & Chemical Corp H S
Tencent Holdings Ltd
Zee Entertainment Enterprises Ltd
Baidu Inc ADR
% Assets
5.57
4.70
3.52
3.51
3.35
3.22
2.96
2.57
2.43
2.43
% Equity
h Cyclical
49.0
r Basic Materials
t Consumer Cyclical
y Financial Services
u Real Estate
3.0
16.9
13.2
16.1
j Sensitive
44.2
i Communication Services
o Energy
p Industrials
a Technology
3.7
4.5
12.3
23.7
k Defensive
6.8
s Consumer Defensive
d Healthcare
f Utilities
1.4
5.3
0.0
©2015 Morningstar. All Rights Reserved. The information contained herein: (1) is proprietary to Morningstar; (2) may not be copied (save (i) as incidentally necessary in the course of viewing it on-line, and (ii) in the course of
printing off single copies of web pages on which it appears for the use of those authorised to view it on-line), adapted or distributed; and (3) is not warranted to be accurate, complete or timely.
®
ß
Page 4 of 5 | Morningstar Research Report | Text as of 15/04/2014, Data as of 09/04/2015
Morningstar Benchmark MSCI AC Asia Ex Japan NR USD
Schroder Asia Pacific Ord SDP
NAV Performance Analysis
Data as of 31-03-2015
Trailing Returns Price
Total
Rtn %
+/Bmark
3 month
6 Month
1 Year
3 Year Ann.
5 Year Ann.
9.62
13.98
26.17
9.43
10.26
-0.54
-0.69
1.81
-0.04
3.55
Trailing Returns NAV
Total
Rtn %
+/Bmark
+/Cat
%Rnk
In Cat
3 month
6 Month
1 Year
3 Year Ann.
5 Year Ann.
9.77
15.18
26.31
10.68
11.00
-0.40
0.50
1.95
1.21
4.29
0.04
1.57
3.28
1.24
5.32
41
30
29
31
5
Morningstar CategoryTM Asia ex Japan Equity
Since Dobbs took charge, the fund has returned
nearly 6.5% annualized to 31 March, compared
with the average fund's return of less than 5%.
That said, it hasn't been a smooth ride. In 2013
the fund underperformed its average peer by
nearly 4% and furthermore it lost money while
the average peer made a positive return. The entire region suffered on concerns over the effect of
tapering by the US Federal Reserve, compounded
Calendar Total Returns
2011
Discount / Premium
Data as of 09-04-2015
Discount / Premium %
High
Average
Low
Z-Statistic
6 Mo
1Yr
3Yr
-7.24
-9.81
-11.42
0.25
-7.24
-9.74
-11.63
0.17
-6.41
-9.67
-12.18
0.08
Risk & Return
Data as of 31-03-2015
Morningstar Rating Return
3 Year
5 Year
10 Year
Overall
Above Avg
High
Above Avg
Above Avg
Risk
Rating
Avg
Avg
Above Avg
Above Avg
QQQQ
QQQQQ
QQQQ
QQQQ
by widespread redemptions from investors out of
emerging-market equities--but this hasn't thrown
the manager off-course as he continues to focus
on the underlying stocks, rather than to make big
macro calls. Returns were hit by poor stock selection in Hong Kong and India, coupled with the underweight stance in China and Australia relative
to the benchmark index. This was compounded by
weakness in some of the region's currencies.
Fund(price)
2012
2013
2014
Fund(NAV)
50
40
30
20
10
0
-10
-20
YTD
The board does not enforce a strict discount control mechanism but they can and do buy back
shares periodically in the market when they feel
it is appropriate to do so. Over the longer term,
they aim to keep the discount below 10%, but
this target is flexible and is monitored in the context of both the average peer group discount and
prevailing market conditions. Historically, share
repurchases have been few and far between. The
average three-year discount at which the fund
has traded was 9.8% (10 April); over a shorter
period, the last six months, it's a little wider at
10.5%. The board facilitated a tender offer in
early 2011, under which 15% of the company's
share capital was repurchased. The exercise of
warrants also helps with liquidity, as did the issuance of subscription shares in Jan 2011, although these have since expired.
Dobbs has used risk well and rewarded his shareholders amply. The level of gearing has been well
managed and kept fairly low, other than in the final quarter of 2008 when it was exacerbated by
the falling markets. The fund is well diversified,
which reduces concentration risk; it comprises
approximately 70 stocks with the top 10 holdings
accounting for only around 36% (31 Jan). Indeed,
the fund's standard deviation, a statistical measure of risk, is fairly in line with its category
peers'; it tends to participate less in downward
markets (although it lost some 5 percentage
points more than its peers in 2008), without compromising on gains in rising markets, and it's
comfortably ahead of its peers on a risk-adjusted
basis over all time periods.
Volatility Ratios
Risk vs Index
3 Year
5 Year
Alpha NAV
Beta NAV
R-Squared NAV
Treynor Ratio NAV
6.10
0.73
47.30
14.79
6.77
0.67
67.62
16.33
Standard Deviation
Mean
Sharpe Ratio
Sortino Ratio
3 Yr NAV
5 Yr NAV
16.59
1.16
0.89
1.47
15.48
1.00
0.81
1.34
©2015 Morningstar. All Rights Reserved. The information contained herein: (1) is proprietary to Morningstar; (2) may not be copied (save (i) as incidentally necessary in the course of viewing it on-line, and (ii) in the course of
printing off single copies of web pages on which it appears for the use of those authorised to view it on-line), adapted or distributed; and (3) is not warranted to be accurate, complete or timely.
®
ß
Page 5 of 5 | Morningstar Research Report | Text as of 15/04/2014, Data as of 09/04/2015
Schroder Asia Pacific Ord SDP
Fees
Management Fee %
Ongoing Charge ex Perf Fee %
1.00
1.10
Gearing
Total Assets £ Mil
Net Assets £ Mil
589.5
579.4
Dividends
Dividend History
2012
2013
2014
Dividend
Special Dividend
3.35
0.00
3.35
0.00
2.75
0.00
Total
3.35
3.35
2.75
Morningstar Benchmark MSCI AC Asia Ex Japan NR USD
Morningstar CategoryTM Asia ex Japan Equity
Schroders takes an annual management fee and
a secretarial fee. The base management fee is
tiered according to the asset base: 1% on assets
up to GBP 100 million; then 0.95% on assets
between GBP 100 million and GBP 300 million;
0.90% on assets between GBP 300 million and
GBP 400 million; and 0.85% on any assets above
GBP 400 million. We like this structure insofar as
it acknowledges economies of scale for shareholders by lowering expenses as assets increase.
The fund's ongoing charges of some 1.1% give it
a cost advantage when compared with its Morningstar Asia ex-Japan Equity median category
fund.
Dobbs has the ability to gear the fund up to 20%,
but in practice he tends to keep it in single digits
when its in use. He takes a tactical view with its
deployment, using a short-term loan, denomin-
ated in USD. That said, his current cautious
stance means that loan, although drawn down, is
being held in cash for now.
The primary aim of the fund is to produce capital
growth and there is no formal income target. The
board does pay a dividend each year, but the
amount can vary and cannot be relied on by
shareholders as a sustainable source of income in
their portfolios. The board has kept a balance in
the revenue reserve account for future use when
they deem it appropriate.
©2015 Morningstar. All Rights Reserved. The information contained herein: (1) is proprietary to Morningstar; (2) may not be copied (save (i) as incidentally necessary in the course of viewing it on-line, and (ii) in the course of
printing off single copies of web pages on which it appears for the use of those authorised to view it on-line), adapted or distributed; and (3) is not warranted to be accurate, complete or timely.
®
ß

