vii v TABLE OF CONTENTS
advertisement
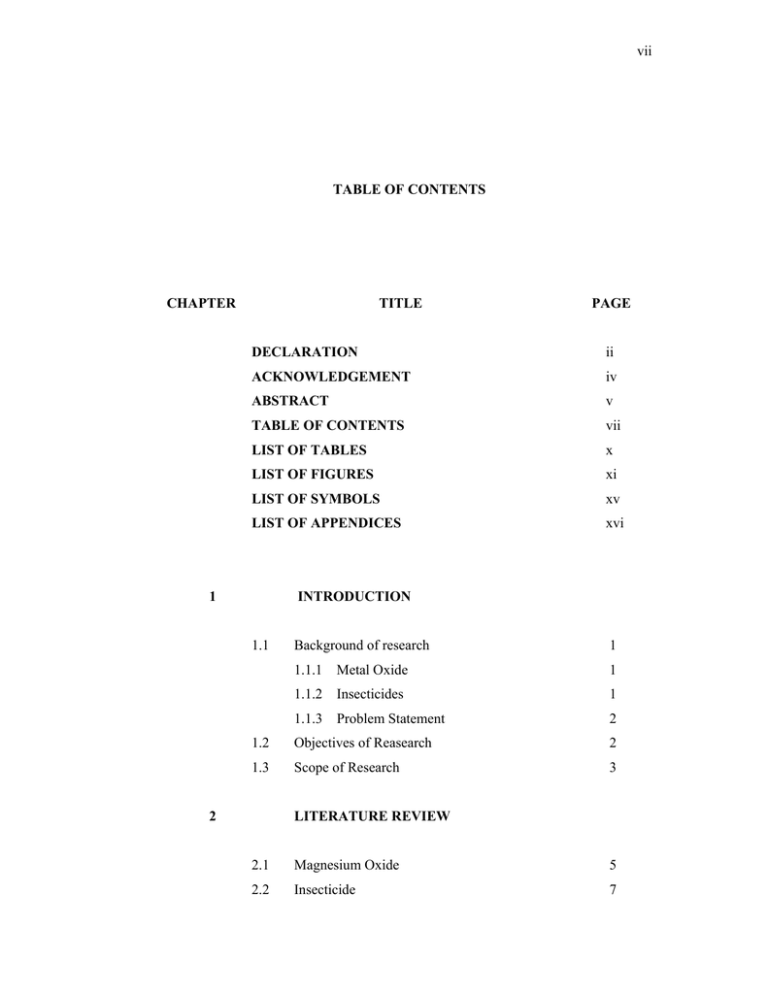
vii TABLE OF CONTENTS CHAPTER TITLE PAGE DECLARATION ii ACKNOWLEDGEMENT iv ABSTRACT v TABLE OF CONTENTS vii LIST OF TABLES x LIST OF FIGURES xi LIST OF SYMBOLS xv LIST OF APPENDICES xvi 1 INTRODUCTION 1.1 Background of research 1 1.1.1 Metal Oxide 1 1.1.2 Insecticides 1 1.1.3 Problem Statement 2 1.2 Objectives of Reasearch 2 1.3 Scope of Research 3 2 LITERATURE REVIEW 2.1 Magnesium Oxide 5 2.2 Insecticide 7 viii 2.2.1 Pyrethrin and Cypermethrin 3 7 EXPERIMENTAL 3.1 Sample Preparation 13 3.1.1 Activated Carbon 13 3.1.2 Cypermethrin 13 3.1.3 Converting Commercial MgO to Mg(OH)2 14 3.1.4 Dehydrated Magnesium Oxide (D-MgO) 15 3.1.5 Dehydrated and Calcined Magnesium Oxide (DC-MgO) 3.1.6 Magnesium Oxide Sol Gel (SG-MgO) 15 3.2 Activation using Vacuum line system 16 3.3 Characterization 17 3.3.1 Fourier Transform Infrared Spectroscopy (FTIR) 17 3.3.2 Scanning Electron Microscopy (SEM) 18 3.3.3 Nitrogen Gas Adsorption (NA) 19 3.3.3.1 Physisorption Isotherms 19 3.3.3.2 The-Brunauer-Emmet-Teller (BET) 21 3.3.3.3 Hysteresis Loop and Pore Clasification 22 3.3.4 X-Ray Diffraction (XRD) 26 3.3.5 Nuclear Magnetic Resonance (NMR) 29 3.3.6 Electron Spin Resonance (ESR) 32 3.4 Gas Chromatography 3.4.1 4 15 Stability Study of Cypermethrin 36 39 RESULTS AND DISSCUSSION 4.0 Introduction 41 4.1 Characterizations 41 4.1.1 Fourier Transform Inrfa-Red (FTIR) 41 4.1.2 Surface Morphology 49 4.1.3 X-Ray Diffraction (XRD) 54 ix 4.1.4 4.1.5 Surface Study using Nitrogen Gas Adsorption (NA) 64 Electron Spin Resonance ESR 72 4.1.5.1 4.1.6 Fs+ Colour Centre Nuclear Magnetic Resonance 4.2 Application in Cypermethrin 4.2.1 Fourier Transform Infra-Red (FTIR) 4.2.2 Gas Chromatography with Electron Capture Detector Analysis 5 77 79 81 81 90 CONCLUSION AND RECOMMENDATIONS 5.1 Conclusion 101 5.2 Recommendations 102 REFERENCES 104 APPENDICES 112 x LIST OF TABLES TABLE NO. TITLE PAGE 3.1 Classifications of pores according to their width 23 3.2 Types of detectors and its selectivity 38 3.3 Operation Parameters for GC-ECD 40 4.1 FTIR peaks assignment 43 4.2 XRD peaks assignment for CM-MgO 55 4.3 XRD peaks assignment for D-Mg(OH)2 and SG-Mg(OH)2 58 4.4 XRD peaks assignment for D-MgO 400, DC-MgO 600 and SG-MgO 400 4.5 60 XRD peaks assignment for D-MgO 600, DC-MgO 600 and SG-MgO 600 63 4.6 Nitrogen Gas Adsorption-Desorption Analysis 70 4.7 Intensity ratio obtain from 1H MAS NMR spectra 79 4.8 Percentage of cypermethrin incubated with MgOs and AC 98 xi LIST OF FIGURES FIGURE NO. TITLE PAGE 1.1 Schematic layout of research scope 3 2.1 The expected pores and cavities in metal oxide 6 2.2 Molecular structures of compounds in pyrethrum 8 2.3 Molecule structures of resmethrin and cypermethrin 10 2.4 Cypermethrin isomers 11 3.1 Schematic layout of converting MgO to Mg(OH)2 14 3.2 Schematic diagram of rotary pump system 16 3.3 Types of BET isotherms 20 3.4 The hyteresis shapes of BET isotherm 23 3.5 Common model of pores (a) slit shape pore, (b) cylindrical shaped pore and (c) pores between connected solid spheres 24 3.6 Types of pores 24 3.7 Simplified X-Ray Diffractometer 26 3.8 Pictorial view of Bragg’s law 27 3.9 Schematic layout of typical NMR spectrometer 30 3.10 Energy levels for a nucleus with spin quantum number ½ 31 3.11 The schematic diagram of an ESR spectrometer 33 3.12 Zeeman energy levels of an electron in an applied magnetic field 34 3.13 ESR sample cell 35 3.14 Schematic diagram of gas chromatography 37 3.15 Schematic diagram of injection port 37 3.16 Schematic diagram of ECD detector 39 4.1 FTIR spectrum of commercial magnesium oxide (CM-MgO) 42 xii 4.2 FTIR spectra of D-Mg(OH)2 and SG-MG(OH)2 4.3 FTIR spectra of D-MgO after activation under vacuum at various temperatures; 200 oC, 400 oC, 600 oC and 800 oC. 4.4 51 SEM micrographs of DC-Mg 200, DC-MgO 400, DC-MgO 600 and DC-MgO 800 with magnification of 1000X. 4.10 50 SEM micrographs of D-Mg 200, D-MgO 400, D-MgO 600 and D-MgO 800 with magnification of 1000X. 4.9 49 SEM micrographs of D-Mg(OH)2 and SG-Mg(OH)2 with magnification of 1000X. 4.8 48 Type of bonding, Type A represent unassociated hydroxyl bond and Type B stretching vibration of adsorbed water molecules 4.7 46 FTIR spectra of SG-MgO after activation under vacuum at various temperatures; 200 oC, 400 oC, 600 oC and 800 oC. 4.6 45 FTIR spectra of DC-MgO after calcinations at various temperatures; 200 oC, 400 oC, 600 oC and 800 oC. 4.5 43 52 SEM micrographs of SG-Mg 200, SG-MgO 400, SG-MgO 600 and SG-MgO 800 with magnification of 1000X. 53 4.11 XRD diffractogram of CM-MgO 55 4.12 XRD diffractograms of D-MgO activated under vacuum at 400 oC and 600 oC respectively 4.13 XRD diffractograms of D-MgO 400, DC-MgO 400 and SG-MgO 400 4.14 57 59 XRD diffractograms of D-MgO 600, DC-MgO 600 and SG-MgO 600 62 4.15 Adsorption-desorption isotherm plot of CM-MgO 64 4.16 Adsorption-desorption isotherms plot of D-MgO 400, D-MgO 600 and D-MgO 800. 66 4.17 Pore size distribution of D-MgO 400 and D-MgO 800 67 4.18 Adsorption-desorption isotherms plot of DC-MgO 400, DC-MgO 600 and DC-MgO 800. 4.19 Adsorption-desorption isotherms plot of SG-MgO 400, SG-MgO 600 and SG-MgO 800. 4.20 68 69 Graph of BET surface area versus temperature for D-MgO, DC-MgO and SG-MgO heated at various temperatures. 71 xiii 4.21 ESR spectra of D-MgO 600 73 4.22 ESR spectra of DC-MgO 600 74 4.23 ESR spectra of SG-MgO 600 76 4.24 Schematic diagram of trapped electron on MgO 77 4.25 SG-MgO 600 shows (a) before UV-irradiation and (b) after UV-irradiation, the formation of surface FS + (H) colour centre. 4.26 1 78 H MAS NMR spectra of D-Mg(OH)2, before and after activation using vacuum at temperature 400 oC, 600 oC and 800 oC 80 4.27 FTIR spectra of blank cypermthrin incubated at 46 ± 2 oC. 83 4.28 FTIR spectra of CM-MgO with cypermthrin incubated at 46 ± 2 oC 84 4.29 FTIR spectra of D-MgO activated under vacuum at 600 oC with cypermthrin incubated at 46 ± 2 oC. 4.30 FTIR spectra of DC-MgO calcined at 600 oC with cypermthrin incubated at 46 ± 2 oC. 4.31 86 FTIR spectra of SG-MgO activated under vacuum at 600 oC with cypermthrin incubated at 46 ± 2 oC. 4.32 85 87 FTIR spectra of activated carbon, (AC) with cypermthrin incubated at 46 ± 2 oC. 88 4.33 Two major pathways for cypermethrin’s degradation 89 4.34 GC-ECD chromatograms of blank cypermethrin monitored in an incubator at 46 ± 2 oC. 4.35 A plot of peak height against incubation time for blank cypermethrin incubated at 46 ± 2 oC. 4.36 93 A plot of peak height against incubation time for cypermethrin incubated with D-MgO at 46 ± 2 oC. 4.40 92 GC-ECD chromatograms of cypermethrin incubated with D-MgO monitored in an incubator at 46 ± 2 oC 4.39 92 A plot of peak height against incubation time for cypermethrin incubated with CM-MgO at 46 ± 2 oC. 4.38 91 GC-ECD chromatograms of cypermethrin incubated with CM-MgO monitored in an incubator at 46 ± 2 oC. 4.37 90 94 GC-ECD chromatograms of cypermethrin incubated with DC-MgO monitored in an incubator at 46 ± 2 oC. 95 xiv 4.41 A plot of peak height against incubation time for cypermethrin incubated with DC-MgO at 46 ± 2 oC. 4.42 GC-ECD chromatograms of cypermethrin incubated with SG-MgO monitored in an incubator at 46 ± 2 oC. 4.43 98 GC-ECD chromatograms of cypermethrin incubated with SG-MgO monitored in an incubator at 46 ± 2 oC. 4.45 97 A plot of peak height against incubation time for cypermethrin incubated with SG-MgO at 46 ± 2 oC. 4.44 96 99 A plot of peak height against incubation time for cypermethrin incubated with SG-MgO at 46 ± 2 oC. 100 xv LIST OF SYMBOLS/ABBREVIATIONS λ 2θ - Wavelength Bragg Angle FTIR - Fourier-Transformed Infrared KBr - Potassium Bromide XRD - X-ray Diffraction Cu Kα - X-ray diffraction from Copper K energy levels PDF - Powder Diffraction File FWHM - Full Width Half Maximum SEM - Scanning Electron Microscopy EDX - Energy Dispersive X-Ray Analysis BET - Brunnauer, Emmett and Teller IUPAC - International Union of Pure and Applied Chemistry NA - Nitrogen Adsorption ESR - Electron Spin Resonance NMR - Nuclear Magnetic Resonance GC-ECD/FID - Gas Chromatography with Electron Capture Detector / Flame Ionization Detector MgO - Magnesium Oxide D-MgO - Dehydrated MgO DC-MgO - Calcine MgO SG-MgO - Sol Gel MgO H2 - Hydrogen OH - Hydroxyl P/Po - Relative pressure; obtained by forming the ratio of the equilibrium pressure and vapour pressure Po of the adsorbate at the temperature where the isotherm is measured xvi LIST OF APPENDICES APPENDIX TITLE PAGE A1 PDF Reference for Magnesium Oxide (MgO) 112 A2 PDF Reference for Magnesium Hydroxide (Mg(OH)2) 113 B1 EDAX analysis for D-Mg(OH)2 114 B2 EDAX analysis for SG-Mg(OH)2 115 B3 EDAX analysis for D-MgO 600 116 B4 EDAX analysis for DC-MgO 600 117 B5 EDAX analysis for SG-MgO 600 118 C1 ESR spectrum in full width 119 C2 Peak height calculation using internal standard D From ESR spectrum 120 Percentage of decrease in GC-ECD data 121
