ii iii iv
advertisement
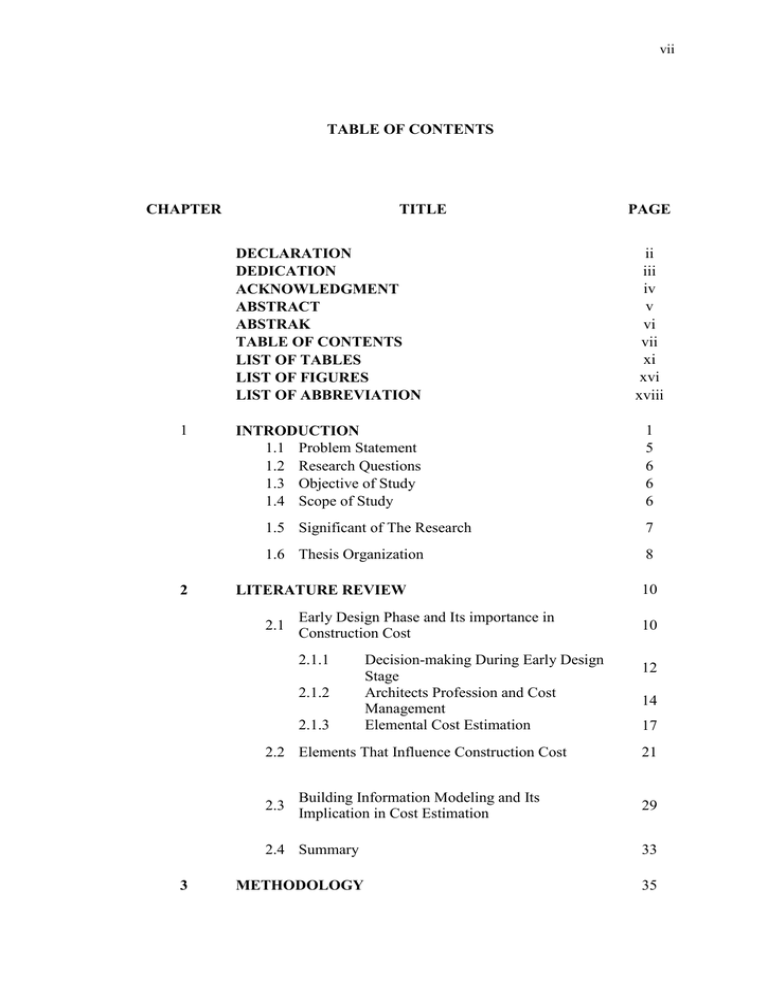
vii TABLE OF CONTENTS CHAPTER 1 2 TITLE DECLARATION DEDICATION ACKNOWLEDGMENT ABSTRACT ABSTRAK TABLE OF CONTENTS LIST OF TABLES LIST OF FIGURES LIST OF ABBREVIATION ii iii iv v vi vii xi xvi xviii INTRODUCTION 1.1 Problem Statement 1.2 Research Questions 1.3 Objective of Study 1.4 Scope of Study 1 5 6 6 6 1.5 Significant of The Research 7 1.6 Thesis Organization 8 LITERATURE REVIEW 2.1 Early Design Phase and Its importance in Construction Cost 2.1.1 2.1.2 2.1.3 Decision-making During Early Design Stage Architects Profession and Cost Management Elemental Cost Estimation 10 10 12 14 17 2.2 Elements That Influence Construction Cost 21 Building Information Modeling and Its Implication in Cost Estimation 29 2.3 2.4 Summary 3 PAGE METHODOLOGY 33 35 viii 3.1 3.2 3.3 3.4 3.5 3.6 3.7 4 EXPERIMENTED DESIGN ELEMENTS 4.1 4.2 4.3 4.4 5 Research Process Statement of Problem Hypothesis Establishment Pilot Study Design Elements Ascertainment Experimentation Methodology 3.6.1 Instrumentation and BIM Simulation 3.6.2 Economical Remodeling 3.7.3 Statistical Analysis The Experimental Model 4.1.1 Door 4.1.2 Window 4.1.3 Wall 4.1.4 Floor 4.1.5 Roof 4.1.6 Beam 4.1.7 Column Takeoff The Experiments 4.3.1 Element A; Door 4.3.2 Element B; Window 4.3.3 Element C; Wall 4.3.4 Element D; Floor 4.3.5 Element E; Roof 4.3.6 Element F; Beam 4.3.7 Element G; Column Summary RESULT AND DATA ANALYSIS 35 38 38 39 41 45 47 50 51 55 55 56 58 59 60 61 62 63 64 68 68 84 98 106 113 117 120 124 125 5.1 An Overview of The Research Process 125 5.2 Result 5.2.1 5.2.2 5.2.3 5.2.4 5.2.5 5.2.6 5.2.7 Summary 126 126 134 142 150 158 167 176 173 5.3 Element A; Door Element B; Window Element C; Wall Element D; Floor Element E; Roof Element F; Beam Element G; Column ix 6 CONCLUSION AND RECOMMENDATION 186 6.1 Summary of Finding 6.2 Objective of The Study 6.2.1 Significant Relationship Between Construction Cost and Design Elements 6.2.2 The Impact of The Design Elements Towards Cost 6.2.3 Costing Consciousness 186 188 6.3 Recommendation for Further Study 198 6.4 Contribution and Final Remark 199 REFERENCES APPENDIX 188 194 196 I VII x LIST OF TABLE TABLE NO. TITLE PAGE Table 2.1 Differences Between Traditional 2D Construction Processes Versus Model Based Process 30 Table 3.1 Result Obtained from Pilot Survey 41 Table 3.2 Items Highlighted in BQ 43 Table 3.3 Item BQ category 1 Grouped Under Design Elements’ Specification 44 Table 3.4 Tabular form A for Data Tabulation of The Experimental Subject 45 Table 3.5 Tabular Form B for Data Tabulation of The Experiments 46 Table 3.6 Tabular Form C for Data Tabulation of The Most Economical Design Elements 51 Table 4.1a Door Element 57 Table 4.1b Window Element 59 Table 4.1c Wall Element 60 Table 4.1d Floor Element 61 Table 4.1e Roof Element 62 Table 4.1f Beam Element 63 Table 4.1g Column Element 64 Table 4.2 Table of Different of Both Quantity Takeoff Done in Revit by The Author and BQ by Quantity Surveyor. 65 Table 4.3 Paired Sample Rest for Revit Takeoff and BQ 67 Table 4.4 Element A Experiment A1 to A12 69 Table 4.5a Experiment A1 70 Table 4.5b Experiment A2 71 xi Table 4.5c Experiment A3 72 Table 4.5d Experiment A4 73 Table 4.5e Experiment A5 74 Table 4.5f Experiment A6 76 Table 4.5g Experiment A7 77 Table 4.5h Experiment A8 78 Table 4.5i Experiment A9 79 Table 4.5j Experiment A10 80 Table 4.5k Experiment A11 81 Table 4.5l Experiment A12 82 Table 4.6 Summary of Experiment Element A 83 Table 4.7 Element B experiment B1 to B12 85 Table 4.8 Façade Changes Based on Windows Designs and Sized Modification 86 Table 4.9a Experiment B1 87 Table 4.9b Experiment B2 88 Table 4.9c Experiment B3 89 Table 4.9d Experiment B4 89 Table 4.9e Experiment B5 90 Table 4.9f Experiment B6 91 Table 4.9g Experiment B7 92 Table 4.9h Experiment B8 93 Table 4.9i Experiment B9 94 Table 4.9j Experiment B10 95 Table 4.9k Experiment B11 96 Table 4.9l Experiment B12 97 Table 4.1 Summary of Experiment Element B 97 Table 4.11 Element C Experiment C1 to C12 98 Table 4.12a Experiment C1 99 xii Table 4.12b Experiment C2 100 Table 4.12c Experiment C3 100 Table 4.12d Experiment C4 101 Table 4.12e Experiment C5 101 Table 4.12f Experiment C6 102 Table 4.12g Experiment C7 102 Table 4.12h Experiment C8 103 Table 4.12i Experiment C9 103 Table 4.12j Experiment C10 104 Table 4.12k Experiment C11 105 Table 4.12l Experiment C12 105 Table 4.13 Summary of Experiment Element C 106 Table 4.14 Element D Experiment D1 to D10 107 Table 4.15a Experiment D1 107 Table 4.15b Experiment D2 108 Table 4.15c Experiment D3 108 Table 4.15d Experiment D4 109 Table 4.15e Experiment D5 110 Table 4.15f Experiment D6 110 Table 4.15g Experiment D7 111 Table 4.15h Experiment D8 111 Table 4.15i Experiment D9 112 Table 4.15j Experiment D10 112 Table 4.16 Summary of Experiment Element D 113 Table 4.17 Element E Experiment E1 to E19 113 Table 4.18a Experiment E1 to E18 115 Table 4.18b Experiment E19 116 Table 4.19 Summary of Experiment element E 117 Table 4.20 Element F Experiment F1 to F15 118 xiii Table 4.21a Experiment F1 to F5 118 Table 4.21b Experiment F6 to F10 119 Table 4.21c Experiment F11 to F15 120 Table 4.22 Summary of Experiment Element F 120 Table 4.23 Element G Experiment G1 to G15 121 Table 4.24a Experiment G1 to G5 122 Table 4.24b Experiment G6 to G10 122 Table 4.24c Experiment G11 to G15 123 Table 4.25 Summary of Experiment Element G 123 Table 5.1 Result of Experiment A1 to A12 127 Table 5.2 Correlation; Door Element 131 Table 5.3a Model Summary; Door Element 133 Table 5.3b Coefficient 133 Table 5.4 Result of Experiment B1 to B12 135 Table 5.5 Correlations; Window Element 140 Table 5.6a Model Summary; Window Element 141 Table 5.6b Coefficient 142 Table 5.7 Result of Experiment C1 to C12 143 Table 5.8 Correlation; Wall Element 147 Table 5.9a Model Summary; Wall Element 149 Table 5.9b Coefficient 149 Table 5.10 Result of Experiment D1 to D10 151 Table 5.11 Correlations; Floor Element 155 Table 5.12a Model Summary; Floor Element 157 Table 5.12b Coefficient 157 Table 5.13 Result Experiment E1 to E19 159 Table 5.14 Correlations; Roof Element 165 Table 5.15a Model Summary; Roof Element 166 Table 5.15b Coefficient 167 xiv Table 5.16 Result of Experiment F1 to F15 168 Table 5.17 Correlations; Beam Element 173 Table 5.18a Model Summary; Beam Element 174 Table 5.18b Coefficient 175 Table 5.19 Result of Experiment G1 to G15 177 Table 5.20 Correlations; Column Element 181 Table 5.21a Model Summary; Column Element 183 Table 5.21b Coefficient 183 Table 5.22 Cost Summary Before and After Undergone The Experiment. 185 Table 6.1a Paired Samples Statistics 187 Table 6.1b Paired Sample Correlations 187 Table 6.1c Paired Sample Test 187 Table 6.2 Relationship Distribution of Design Elements Toward the Construction Cost 188 Table 6.3 Model Summary of Design Elements 190 Table 6.4 Model Summary of Design Elements’ Characteristic 191 Table Relationship Between Design Elements, Elements’ Characteristic Toward The Construction Cost. 192 Table 6.3 Level of Construction Cost Dependency on Design Elements in Descending Order 194 Table 6.4 Fractionation of The Design Elements. 195 6.5 xv LIST OF FIGURE FIGURE NO TITLE PAGE Figure 1.1 Building Cost Influential Factors 3 Figure 2.1 Architectural consultancy; architects’ scope of works 16 Figure 2.2 Cost estimation starts after the schematic phase in the basic architectural service 18 Figure 2.3 Project and cost estimating process 20 Figure 2.4 Construction Cost Organization diagram 25 Figure 2.5 Construction Cost Organization diagram 26 Figure 2.6 Construction Cost Organization diagram 27 Figure 2.7 Construction Cost Organization diagram 28 Figure 2.8 BIM integrated Model 32 Figure 2.9 Summary of Construction Cost Dependency 34 Figure 3.1 Research Process 36 Figure 3.2 Prototype of The Multipurpose Hall Produced in Autodesk Revit 46 Figure 3.3 Window Component Produced in Revit Attached With Its Property and Type Property 48 Figure 3.4 Example of Window Schedule Applied in One of The Simulated Model 49 Figure 3.5 BIM Simulation Operation 49 Figure 3.6 The Statistical Analyses Involved in This Study 52 Figure 4.1 The 3D view of The Multipurpose Hall 55 Figure 4.2 The Elevation Views of The Multipurpose Hall Highlighted on The Roof Skyline 61 Figure 4.2a Side Elevation 61 Figure 4.2b Front Elevation 62 Figure 4.3 Construction Cost Based on Takeoff 66 Figure 4.4 Cost Based on Its Elements 67 xvi Figure 5.1 Line Graph of Result Experiment A1 to A12 128 Figure 5.2 Impact of Door Cost to The Construction Cost 129 Figure 5.3 Scatterplot of Door Operation to Construction cost 130 Figure 5.4 Scatterplot of Door Panel Material to Construction cost 130 Figure 5.5 Line Graph of Result Experiment B1 to B12 136 Figure 5.6 Impact of Windows Cost to The Construction Cost 137 Figure 5.7 Scatterplot of Window Type to Construction Cost 138 Figure 5.8 Scatterplot of Window Size to Construction Cost 138 Figure 5.9 Scatterplot Wall Cost to Window Cost 139 Figure 5.10 Line Graph of Result Experiment C1 to C10 144 Figure 5.11 Impact of Wall Cost to The Construction Cost 145 Figure 5.12 Scatterplot of Wall Material to Construction Cost 146 Figure 5.13 Scatterplot of Wall Finish to Construction Cost 146 Figure 5.14 Line Graph of Result Experiment D1 to D10 152 Figure 5.15 Impact of Floor Cost to The Construction Cost 152 Figure 5.16 Scatterplot of Floor Type to Construction Cost 154 Figure 5.17 Scatterplot of Floor Material to Construction Cost 154 Figure 5.18 Line Graph of Result Experiment E1 to E19 158 Figure 5.19 Impact of Roof Cost to The Construction Cost 161 Figure 5.2 Scatterplot of Roof Profile to Construction Cost 163 Figure 5.21 Scatterplot of Roof Material to Construction Cost 163 Figure 5.22 Scatterplot of Roof Frame to Construction Cost 163 Figure 5.23 Scatterplot of Wall Cost to Construction Cost 163 Figure 5.24 Line Graph of Result Experiment F1 to F15 170 Figure 5.25 Impact of Beam Cost to The Construction Cost 171 Figure 5.26 Scatterplot of Beam Type to Construction Cost 172 Figure 5.27 Scatterplot of Beam Size to Construction Cost 172 Figure 5.28 Line Graph of Result Experiment G1 to G15 176 xvii Figure 5.29 Impact of Column Cost to The Construction Cost 179 Figure 5.3 Scatterplot of Column Type to Construction Cost 180 Figure 5.31 Scatterplot of Column Size to Construction Cost 180 Figure 6.1 Relationship Distribution of Design Elements Toward the Construction Cost 189 Figure 6.2 The strength of Elements’ Characteristic to The Construction Cost. 193 Figure 6.3 Percentage of Design Elements’ Contribution to The Construction Cost Defined by Their Characters 195 TABLE OF ABBREVIATION BIM Building Information Modelling BQ Bill of Quantity QS Quantity Surveyor MYR Malaysian Ringgit JKR Jabatan Kerja Raya PWD Department of Public Works CIDB Construction Industry Development Board Malaysia
