FINAL EXAM REVIEW
advertisement
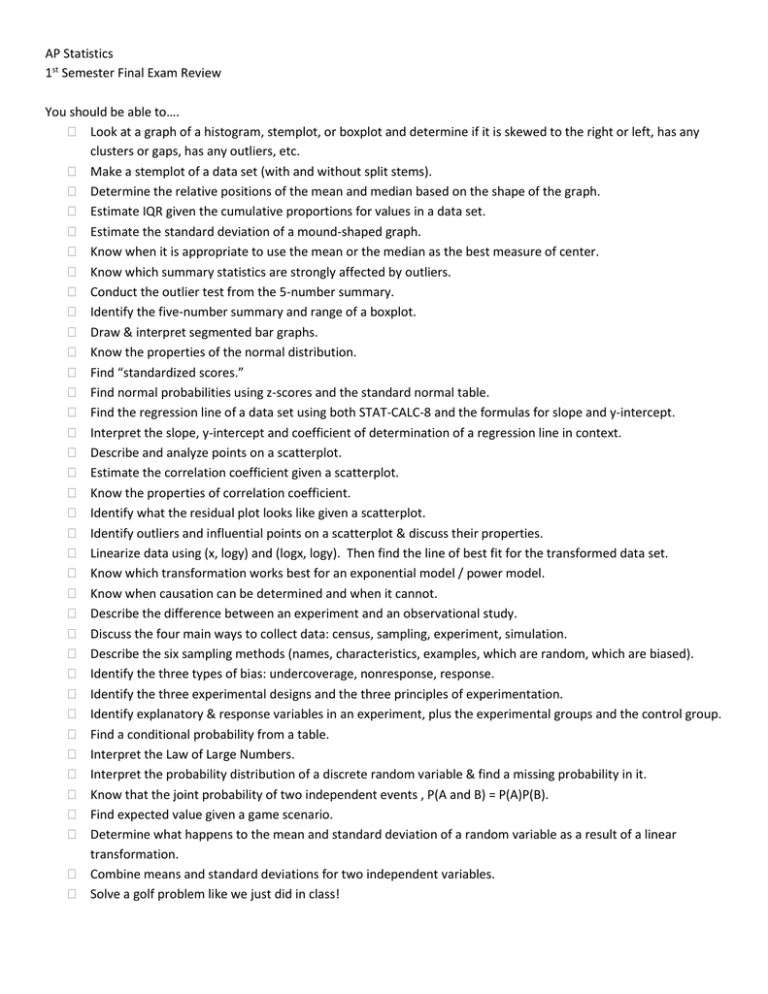
AP Statistics 1st Semester Final Exam Review You should be able to…. Look at a graph of a histogram, stemplot, or boxplot and determine if it is skewed to the right or left, has any clusters or gaps, has any outliers, etc. Make a stemplot of a data set (with and without split stems). Determine the relative positions of the mean and median based on the shape of the graph. Estimate IQR given the cumulative proportions for values in a data set. Estimate the standard deviation of a mound-shaped graph. Know when it is appropriate to use the mean or the median as the best measure of center. Know which summary statistics are strongly affected by outliers. Conduct the outlier test from the 5-number summary. Identify the five-number summary and range of a boxplot. Draw & interpret segmented bar graphs. Know the properties of the normal distribution. Find “standardized scores.” Find normal probabilities using z-scores and the standard normal table. Find the regression line of a data set using both STAT-CALC-8 and the formulas for slope and y-intercept. Interpret the slope, y-intercept and coefficient of determination of a regression line in context. Describe and analyze points on a scatterplot. Estimate the correlation coefficient given a scatterplot. Know the properties of correlation coefficient. Identify what the residual plot looks like given a scatterplot. Identify outliers and influential points on a scatterplot & discuss their properties. Linearize data using (x, logy) and (logx, logy). Then find the line of best fit for the transformed data set. Know which transformation works best for an exponential model / power model. Know when causation can be determined and when it cannot. Describe the difference between an experiment and an observational study. Discuss the four main ways to collect data: census, sampling, experiment, simulation. Describe the six sampling methods (names, characteristics, examples, which are random, which are biased). Identify the three types of bias: undercoverage, nonresponse, response. Identify the three experimental designs and the three principles of experimentation. Identify explanatory & response variables in an experiment, plus the experimental groups and the control group. Find a conditional probability from a table. Interpret the Law of Large Numbers. Interpret the probability distribution of a discrete random variable & find a missing probability in it. Know that the joint probability of two independent events , P(A and B) = P(A)P(B). Find expected value given a game scenario. Determine what happens to the mean and standard deviation of a random variable as a result of a linear transformation. Combine means and standard deviations for two independent variables. Solve a golf problem like we just did in class! Know these terms… Symmetric Cluster (on a graph, not sample) Interquartile range First quartile Third quartile Variance Mean Standard deviation Outlier Cumulative proportion Five number summary Correlation coefficient Influential point Census sampling Experiment observational study Simple random sample Voluntary response sample Stratified random sample Homogeneous Undercoverage Nonresponse Response bias Control Randomization Replication Completely randomized design Block design Matched pairs design Explanatory variable Response variable Control group Experimental group Standardized score Standard normal curve Expected value Joint probability = P(A and B)
