Combined use of stable isotope and fatty acid analyses reveal... segregation by salinity habitats in a coastal population of European...
advertisement

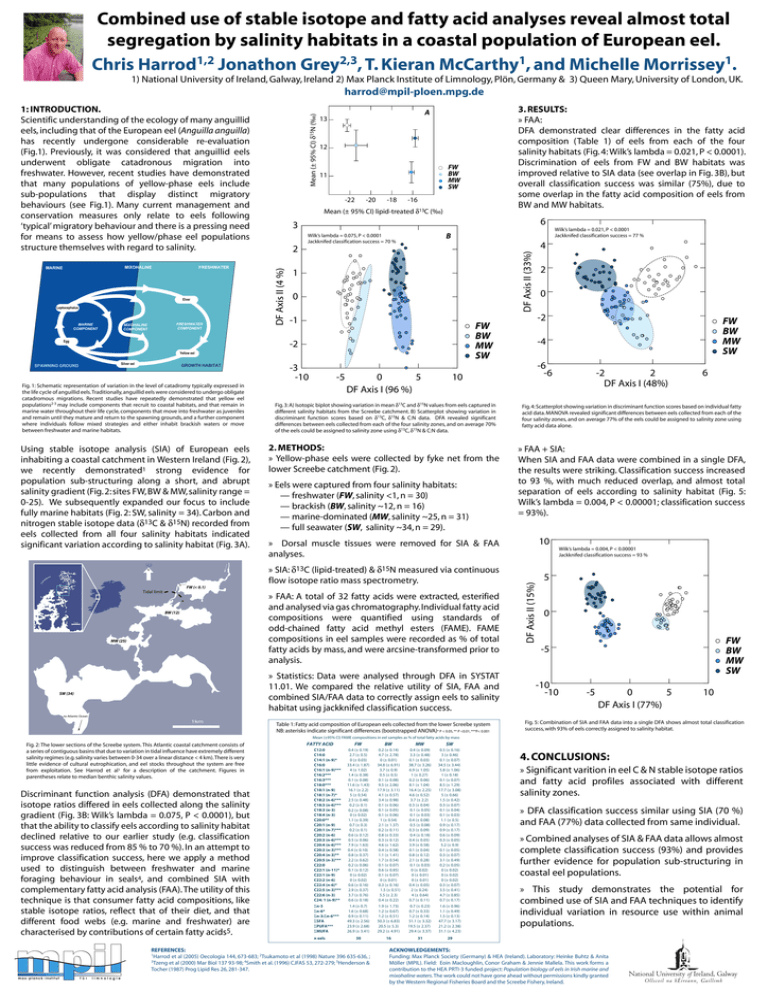
Combined use of stable isotope and fatty acid analyses reveal almost total segregation by salinity habitats in a coastal population of European eel. 1,2 2,3 1 1 Chris Harrod Jonathon Grey , T. Kieran McCarthy , and Michelle Morrissey . 1) National University of Ireland, Galway, Ireland 2) Max Planck Institute of Limnology, Plön, Germany & 3) Queen Mary, University of London, UK. harrod@mpil-ploen.mpg.de Elver Leptocephalus MARINE COMPONENT FRESHWATER COMPONENT MIXOHALINE COMPONENT Egg 12 FW BW MW SW 11 -20 -18 -16 Mean (± 95% CI) lipid-treated δ13C (‰) 6 3 2 B Wilk’s lambda = 0.075, P < 0.0001 Jackknifed classification success = 70 % 1 0 -1 Yellow eel Silver eel GROWTH HABITAT Fig. 1: Schematic representation of variation in the level of catadromy typically expressed in the life cycle of anguillid eels. Traditionally, anguillid eels were considered to undergo obligate catadromous migrations. Recent studies have repeatedly demonstrated that yellow eel populations2-3 may include components that recruit to coastal habitats, and that remain in marine water throughout their life cycle, components that move into freshwater as juveniles and remain until they mature and return to the spawning grounds, and a further component where individuals follow mixed strategies and either inhabit brackish waters or move between freshwater and marine habitats. Using stable isotope analysis (SIA) of European eels inhabiting a coastal catchment in Western Ireland (Fig. 2), we recently demonstrated1 strong evidence for population sub-structuring along a short, and abrupt salinity gradient (Fig. 2: sites FW, BW & MW, salinity range = 0-25). We subsequently expanded our focus to include fully marine habitats (Fig. 2: SW, salinity = 34). Carbon and nitrogen stable isotope data (δ13C & δ15N) recorded from eels collected from all four salinity habitats indicated significant variation according to salinity habitat (Fig. 3A). CO N N MA NE RA FW (< 0.1) Tidal limit -3 -10 -5 0 5 DF Axis I (96 %) 5 km MW (25) -2 FW BW MW SW -4 -6 -6 2 -2 DF Axis I (48%) 6 Fig. 3: A) Isotopic biplot showing variation in mean δ13C and δ15N values from eels captured in different salinity habitats from the Screebe catchment. B) Scatterplot showing variation in discriminant function scores based on δ13C, δ15N & C:N data. DFA revealed significant differences between eels collected from each of the four salinity zones, and on average 70% of the eels could be assigned to salinity zone using δ13C, δ15N & C:N data. Fig. 4: Scatterplot showing variation in discriminant function scores based on individual fatty acid data. MANOVA revealed significant differences between eels collected from each of the four salinity zones, and on average 77% of the eels could be assigned to salinity zone using fatty acid data alone. 2. METHODS: » Yellow-phase eels were collected by fyke net from the lower Screebe catchment (Fig. 2). » FAA + SIA: When SIA and FAA data were combined in a single DFA, the results were striking. Classification success increased to 93 %, with much reduced overlap, and almost total separation of eels according to salinity habitat (Fig. 5: Wilk’s lambda = 0.004, P < 0.00001; classification success = 93%). » Eels were captured from four salinity habitats: — freshwater (FW, salinity <1, n = 30) — brackish (BW, salinity ~12, n = 16) — marine-dominated (MW, salinity ~25, n = 31) — full seawater (SW, salinity ~34, n = 29). 10 » Dorsal muscle tissues were removed for SIA & FAA analyses. » SIA: δ13C (lipid-treated) & δ15N measured via continuous flow isotope ratio mass spectrometry. » Statistics: Data were analysed through DFA in SYSTAT 11.01. We compared the relative utility of SIA, FAA and combined SIA/FAA data to correctly assign eels to salinity habitat using jackknifed classification success. SW (34) 0 10 » FAA: A total of 32 fatty acids were extracted, esterified and analysed via gas chromatography. Individual fatty acid compositions were quantified using standards of odd-chained fatty acid methyl esters (FAME). FAME compositions in eel samples were recorded as % of total fatty acids by mass, and were arcsine-transformed prior to analysis. BW (12) 2 FW BW MW SW -2 SPAWNING GROUND Wilk’s lambda = 0.021, P < 0.0001 Jackknifed classification success = 77 % 4 DF Axis II (33%) Glass eel 13 DF Axis II (15%) FRESHWATER 3. RESULTS: » FAA: DFA demonstrated clear differences in the fatty acid composition (Table 1) of eels from each of the four salinity habitats (Fig. 4: Wilk’s lambda = 0.021, P < 0.0001). Discrimination of eels from FW and BW habitats was improved relative to SIA data (see overlap in Fig. 3B), but overall classification success was similar (75%), due to some overlap in the fatty acid composition of eels from BW and MW habitats. A -22 DF Axis II (4 %) MIXOHALINE MARINE Mean (± 95% CI) δ15N (‰) 1: INTRODUCTION. Scientific understanding of the ecology of many anguillid eels, including that of the European eel (Anguilla anguilla) has recently undergone considerable re-evaluation (Fig.1). Previously, it was considered that anguillid eels underwent obligate catadronous migration into freshwater. However, recent studies have demonstrated that many populations of yellow-phase eels include sub-populations that display distinct migratory behaviours (see Fig.1). Many current management and conservation measures only relate to eels following ‘typical’ migratory behaviour and there is a pressing need for means to assess how yellow/phase eel populations structure themselves with regard to salinity. Wilk’s lambda = 0.004, P < 0.00001 Jackknifed classification success = 93 % 5 0 FW BW MW SW -5 -10 -10 -5 5 0 DF Axis I (77%) 10 to Atlantic Ocean 1km Table 1: Fatty acid composition of European eels collected from the lower Screebe system NB: asterisks indicate significant differences (bootstrapped ANOVA)* P < 0.05, ** P <0.01, ***P< 0.001 Fig. 5: Combination of SIA and FAA data into a single DFA shows almost total classification success, with 93% of eels correctly assigned to salinity habitat. Mean (±95% CI) FAME compositions in eel samples as % of total fatty acids by mass Fig. 2: The lower sections of the Screebe system. This Atlantic coastal catchment consists of a series of contiguous basins that due to variation in tidal influence have extremely different salinity regimes (e.g. salinity varies between 0-34 over a linear distance < 4 km). There is very little evidence of cultural eutrophication, and eel stocks throughout the system are free from exploitation. See Harrod et al1 for a description of the catchment. Figures in parentheses relate to median benthic salinity values. Discriminant function analysis (DFA) demonstrated that isotope ratios differed in eels collected along the salinity gradient (Fig. 3B: Wilk’s lambda = 0.075, P < 0.0001), but that the ability to classify eels according to salinity habitat declined relative to our earlier study (e.g. classification success was reduced from 85 % to 70 %). In an attempt to improve classification success, here we apply a method used to distinguish between freshwater and marine foraging behaviour in seals4, and combined SIA with complementary fatty acid analysis (FAA). The utility of this technique is that consumer fatty acid compositions, like stable isotope ratios, reflect that of their diet, and that different food webs (e.g. marine and freshwater) are characterised by contributions of certain fatty acids5. FATTY ACID FW BW MW SW C12:0 C14:0 C14:1 (n-9)* C16:0 C16:1 (n-9)*** C16:2*** C16:3*** C18:0*** C18:1 (n-9) C18:1 (n-7)* C18:2 (n-6)*** C18:3 (n-6)*** C18:3 (n-3) C18:4 (n-3) C20:0** C20:1 (n-9) C20:1 (n-7)*** C20:2 (n-6) C20:3 (n-6)*** C20:4 (n-6)*** C20:3 (n-3)*** C20:4 (n-3)** C20:5 (n-3)*** C22:0 C22:1 (n-11)* C22:1 (n-9) C22:2 (n-6) C22:4 (n-6)* C22:5 (n-3)*** C22:6 (n-3) C24: 1 (n-9)** 0.4 (± 0.19) 2.7 (± 0.5) 0 (± 0.03) 33.4 (± 1.87) 4 (± 1.02) 1.4 (± 0.38) 0.1 (± 0.08) 11.6 (± 1.43) 16.1 (± 2.2) 5 (± 0.54) 2.5 (± 0.48) 0.2 (± 0.1) 0.2 (± 0.08) 0 (± 0.02) 1.1 (± 0.39) 0.7 (± 0.3) 0.2 (± 0.1) 0.6 (± 0.12) 0.5 (± 0.06) 7.9 (± 1.63) 0.4 (± 0.10) 0.8 (± 0.37) 2.2 (± 0.62) 0.2 (± 0.06) 0.1 (± 0.12) 0 (± 0.02) 0 (± 0.02) 0.6 (± 0.16) 2.9 (± 0.37) 3.7 (± 0.76) 0.6 (± 0.18) 0.2 (± 0.14) 4.7 (± 2.78) 0 (± 0.01) 34.8 (± 6.91) 3.7 (± 0.9) 0.5 (± 0.5) 0.1 (± 0.08) 9.5 (± 2.06) 17.9 (± 3.11) 4.1 (± 0.57) 3.4 (± 0.98) 0.1 (± 0.06) 0.1 (± 0.05) 0.1 (± 0.06) 1 (± 0.54) 2.1 (± 1.37) 0.2 (± 0.11) 0.8 (± 0.33) 0.3 (± 0.12) 4.6 (± 1.62) 0.4 (± 0.58) 1.1 (± 1.41) 1.7 (± 0.54) 0.1 (± 0.07) 0.6 (± 0.85) 0.1 (± 0.07) 0 (± 0.01) 0.3 (± 0.16) 1.5 (± 0.51) 5.5 (± 2.3) 0.4 (± 0.22) 0.4 (± 0.09) 3.3 (± 0.48) 0.1 (± 0.03) 38.7 (± 3.26) 6.9 (± 1.05) 1 (± 0.27) 0.2 (± 0.06) 8.1 (± 1.04) 16.4 (± 2.25) 4.6 (± 0.52) 3.7 (± 2.2) 0.3 (± 0.04) 0.1 (± 0.05) 0.1 (± 0.03) 0.4 (± 0.08) 0.5 (± 0.08) 0.3 (± 0.09) 0.4 (± 0.18) 0.4 (± 0.05) 3.9 (± 0.58) 0.1 (± 0.04) 0.8 (± 0.12) 2.1 (± 0.28) 0.1 (± 0.03) 0 (± 0.02) 0 (± 0.01) 0 (± 0.01) 0.4 (± 0.05) 2 (± 0.24) 4 (± 0.64) 0.7 (± 0.11) 0.5 (± 0.16) 3 (± 0.46) 0.1 (± 0.07) 34.5 (± 3.44) 5.8 (± 1.06) 1 (± 0.18) 0.1 (± 0.07) 8.5 (± 1.29) 17.7 (± 3.08) 5 (± 0.66) 1.5 (± 0.42) 0.3 (± 0.07) 0.1 (± 0.04) 0.1 (± 0.03) 1.1 (± 0.5) 0.9 (± 0.17) 0.9 (± 0.17) 0.6 (± 0.09) 0.3 (± 0.05) 5.2 (± 0.9) 0.1 (± 0.05) 0.3 (± 0.07) 3.1 (± 0.49) 0.2 (± 0.05) 0 (± 0.02) 0 (± 0.02) 0 (± 0.02) 0.3 (± 0.07) 3.5 (± 0.41) 4.7 (± 0.85) 0.7 (± 0.17) Σn-3 Σn-6* Σn-3:Σn-6*** ΣSFA ΣPUFA*** ΣMUFA 1.4 (± 0.7) 1.6 (± 0.68) 0.9 (± 0.11) 49.3 (± 2.56) 23.9 (± 2.68) 26.9 (± 3.41) 1.9 (± 1.73) 1.2 (± 0.67) 1.2 (± 0.51) 50.3 (± 6.83) 20.5 (± 5.3) 29.2 (± 4.91) 0.7 (± 0.23) 0.7 (± 0.33) 1.2 (± 0.14) 51.1 (± 3.32) 19.5 (± 2.37) 29.4 (± 3.37) 1.6 (± 0.96) 1.1 (± 0.49) 1.5 (± 0.13) 47.7 (± 3.17) 21.2 (± 2.38) 31.1 (± 4.23) 30 16 31 29 n eels REFERENCES: 1Harrod et al (2005) Oecologia 144, 673-683; 2Tsukamoto et al (1998) Nature 396 635-636, ; 3Tzeng et al (2000) Mar Biol 137 93-98; 4Smith et al. (1996) CJFAS 53, 272-279; 5Henderson & Tocher (1987) Prog Lipid Res 26, 281-347. 4. CONCLUSIONS: » Significant varition in eel C & N stable isotope ratios and fatty acid profiles associated with different salinity zones. » DFA classification success similar using SIA (70 %) and FAA (77%) data collected from same individual. » Combined analyses of SIA & FAA data allows almost complete classification success (93%) and provides further evidence for population sub-structuring in coastal eel populations. » This study demonstrates the potential for combined use of SIA and FAA techniques to identify individual variation in resource use within animal populations. ACKNOWLEDGEMENTS: Funding: Max Planck Society (Germany) & HEA (Ireland). Laboratory: Heinke Buhtz & Anita Möller (MPIL). Field: Eoin Macloughlin, Conor Graham & Jennie Mallela. This work forms a contribution to the HEA PRTI-3 funded project: Population biology of eels in Irish marine and mixohaline waters. The work could not have gone ahead without permissions kindly granted by the Western Regional Fisheries Board and the Screebe Fishery, Ireland.


