1Q
International Alpha Fund
2016
Investor: SCIEX | Advisor: SCVEX
Fund overview
Morningstar Ratings
— Investment style uses a bottom-up, growth-oriented strategy for stock evaluation
««««
— Fundamental, research-driven approach which seeks to identify companies with a "growth gap"—where
our expectations of forward earnings growth will exceed the market's expectations
Out of 712 funds in the Foreign Large
Blend Category
— Concentrated, "best-ideas" portfolio typically composed of 40–60 stocks blending core and
opportunistic holdings
Investor Shares
Total Net Assets ($million)
Fund: 159.2
Number of Holdings
Fund statistics
Fund: 59
Benchmark: 926
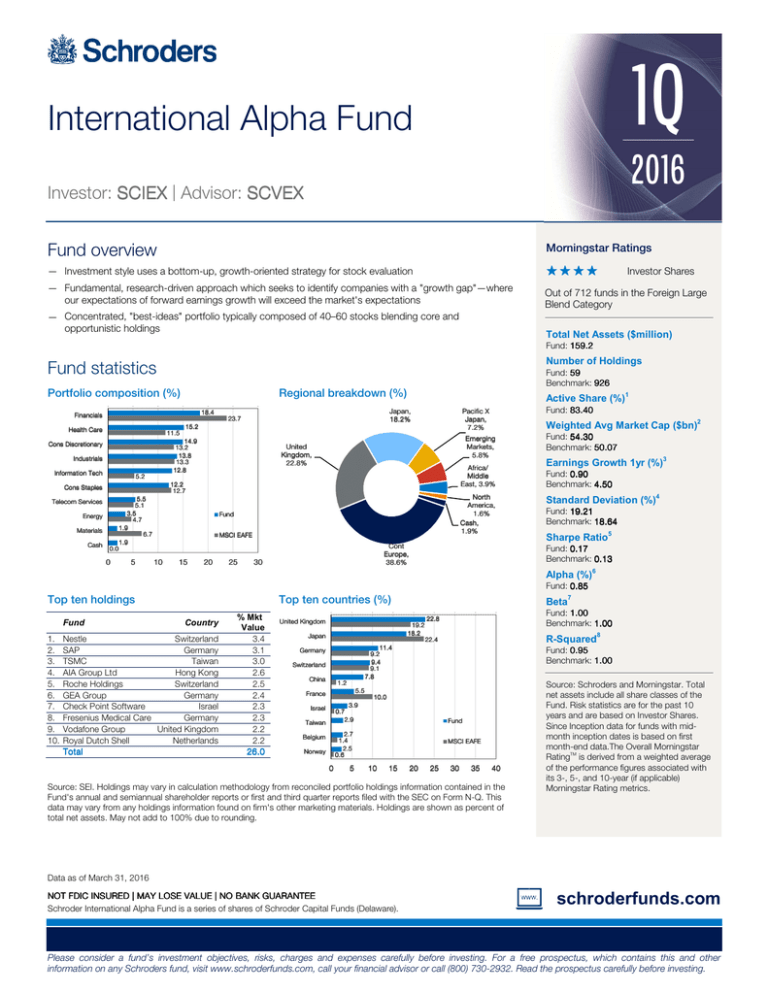
Portfolio composition (%)
Regional breakdown (%)
18.4
Financials
Health Care
11.5
Industrials
Information Tech
5.2
Energy
Materials
Cash
United
Kingdom,
22.8%
5.5
5.1
3.5
4.7
1.9
6.7
1.9
0.0
0
5
North
America,
1.6%
Cash,
1.9%
MSCI EAFE
15
20
25
Weighted Avg Market Cap ($bn)2
Africa/
Middle
East, 3.9%
Fund
10
Fund: 83.40
Emerging
Markets,
5.8%
12.2
12.7
Cons Staples
Telecom Services
23.7
Pacific X
Japan,
7.2%
15.2
14.9
13.2
13.8
13.3
12.8
Cons Discretionary
Active Share (%)1
Japan,
18.2%
Cont
Europe,
38.6%
30
Fund: 54.30
Benchmark: 50.07
Earnings Growth 1yr (%)3
Fund: 0.90
Benchmark: 4.50
Standard Deviation (%)4
Fund: 19.21
Benchmark: 18.64
Sharpe Ratio5
Fund: 0.17
Benchmark: 0.13
Alpha (%)6
Fund: 0.85
Top ten holdings
Fund
1.
2.
3.
4.
5.
6.
7.
8.
9.
10.
Top ten countries (%)
Country
Nestle
Switzerland
SAP
Germany
TSMC
Taiwan
AIA Group Ltd
Hong Kong
Roche Holdings
Switzerland
GEA Group
Germany
Check Point Software
Israel
Tech
Fresenius
Medical Care
Germany
Ag
Vodafone
Group
United Kingdom
Royal Dutch Shell
Netherlands
Total
% Mkt
Value
3.4
3.1
3.0
2.6
2.5
2.4
2.3
2.3
2.2
2.2
26.0
United Kingdom
Beta7
19.2
18.2
Japan
Fund: 1.00
Benchmark: 1.00
22.4
R-Squared8
11.4
9.2
9.4
9.1
7.8
Germany
Switzerland
China
22.8
1.2
5.5
France
Fund: 0.95
Benchmark: 1.00
10.0
3.9
0.7
2.9
Israel
Taiwan
Fund
2.7
1.4
2.5
0.6
Belgium
Norway
0
5
MSCI EAFE
10
15
20
25
30
35
40
Source: SEI. Holdings may vary in calculation methodology from reconciled portfolio holdings information contained in the
Fund's annual and semiannual shareholder reports or first and third quarter reports filed with the SEC on Form N-Q. This
data may vary from any holdings information found on firm's other marketing materials. Holdings are shown as percent of
total net assets. May not add to 100% due to rounding.
Source: Schroders and Morningstar. Total
net assets include all share classes of the
Fund. Risk statistics are for the past 10
years and are based on Investor Shares.
Since Inception data for funds with midmonth inception dates is based on first
month-end data.The Overall Morningstar
RatingTM is derived from a weighted average
of the performance figures associated with
its 3-, 5-, and 10-year (if applicable)
Morningstar Rating metrics.
Data as of March 31, 2016
NOT FDIC INSURED | MAY LOSE VALUE | NO BANK GUARANTEE
Schroder International Alpha Fund is a series of shares of Schroder Capital Funds (Delaware).
schroderfunds.com
Please consider a fund’s investment objectives, risks, charges and expenses carefully before investing. For a free prospectus, which contains this and other
information on any Schroders fund, visit www.schroderfunds.com, call your financial advisor or call (800) 730-2932. Read the prospectus carefully before investing.
Schroder International Alpha Fund
Performance* (%)
As of March 31, 2016
20
Investor Shares
Advisor Shares
15
Fees and Expenses
(%) as of
March 1, 2016
MSCI EAFE Index
10
7.24
5
2.54
2.29
2.23
0
-5
1.34
1.08
2.29
2.56
2.31
6.97
Investor
Shares
Advisor
Shares
Gross
1.17
1.42
Net
0.95
1.20
7.28
1.80
- 2.44 - 2.45 - 3.01
- 7.40 - 7.59 - 8.27
-10
-15
QTD
1 Year
3 Year
5 Year
10 Year
Since Inception**
YTD 2016
2015
2014
2013
2012
Investor Shares
-2.44
-0.17
-5.56
20.63
19.00
Advisor Shares
-2.45
-0.43
-5.74
20.28
18.67
MSCI EAFE Index
-3.01
-0.81
-4.90
22.78
17.32
Performance shown represents past performance. Past performance is no guarantee of future results and
current performance may be higher or lower than the performance shown. Principal value and investment
redeemed,, may be worth more or less than their original cost. For the
returns will fluctuate so that shares, when redeemed
most recent monthmonth -end performance, visit www.schroderfunds.com or call (800) 730730 -2932. Shares held for two
months or less are subject to a 2% redemption fee. Performance for periods less than one
on e year is not
annualized and performance of periods greater than one year is annualized.
*Please see Important Information for notes accompanying this update. The notes include a description of the index
and certain risks associated with investing in the Fund. **Performance shown for Advisor Shares for periods prior to
inception listed, is that of Investor Shares of the Fund (12/19/85).
Fund information
In order to limit the Fund's expenses, the Fund's
adviser has contractually agreed through February
28, 2017, if necessary, to waive its fees, pay Fund
operating expenses, and/or reimburse the Fund to
the extent that Total Annual Fund Operating
Expenses (other than acquired fund fees and
expenses, other indirect acquired fund expenses,
interest, taxes, and extraordinary expenses), for the
Fund's Investor Shares, exceed 0.95% of Investor
Shares' average daily net assets and, for the Fund's
Advisor Shares, exceed 1.20% of Advisor Shares'
average daily net assets. In addition, the Fund's
adviser has contractually agreed through February
28, 2017 to limit the management fees paid by the
Fund to 0.70% of the Fund's average daily net
assets. The expense limitation and the management
fee limitation may only be terminated during their
terms by the Board of Trustees.
Management team
Investor Shares
Advisor Shares
CUSIP
808088207
808088710
Inception Date
12/19/1985
5/15/2006
— Lead portfolio manager Simon Webber
— Over 16 years investment experience
— Joined Schroders in 1999, portfolio manager on the fund since 2010
— Team of 13 global sector specialists and fund managers dedicated to
global growth equities
— Global sector specialists centralized in London draw upon work of over
70 locally based research analysts
Risk: All investments, domestic and foreign, involve risks including the risk of possible loss of principal. The market value of a fund's portfolio may decline
as a result of a number of factors, including adverse economic and market conditions, prospects of stocks in the portfolio, changing interest rates, and real
or perceived adverse competitive industry conditions. Investing overseas involves special risks including among others, risk related to political or economic
instability, foreign currency (such as exchange, valuation, and fluctuation) risk, market entry or exit restrictions, illiquidity and taxation. These risks exist to a
greater extent in emerging markets than they do in developed markets. Please see the prospectus for a full description of the risks associated with the
Fund.
Important Information: Source: Schroders. Morningstar: The Investor Shares of the International Alpha Fund was rated 4 stars overall (out of 712 funds), 4 stars for the 3 year
period (out of 712 funds), 3 stars for the 5 year period (out of 624 funds), 4TM stars for the 10 year period (out of 359 funds) within the Foreign Large Blend category. For each fund
with at least a 3-year history, Morningstar calculates a Morningstar Rating based on a Morningstar Risk-Adjusted return measure that accounts for variation in a fund's monthly
performance (including the effects of sales charges, loads and redemption fees), placing more emphasis on downward variations and rewarding consistent performance. The top
10% of funds in each category receive five stars, the next 22.5% receive four stars, the next 35% receive three stars, the next 22.5% receive two stars and the bottom 10%
receive one star. (Each share class is counted as a fraction of one fund within this scale and rated separately, which may cause slight variations in the distribution percentages.)
The Overall Morningstar Rating for a TM
fund is derived from a weighted average of the performance figures associated with its three-, five-, and ten-year (if applicable) Morningstar
Rating metrics. Morningstar Rating is for individual share classes only. Other classes may have different performance characteristics. Ratings marked with ‡ represent
Morningstar Extended Performance Ratings. Morningstar provides adjusted historical returns and an Extended Performance Rating for some mutual funds in its universe. This
means that any share class that doesn’t have a 1, 3-, 5-, or 10-year performance history may receive a hypothetical Morningstar Rating based on the oldest surviving share class
of the fund. First, Morningstar computes the funds’ new return stream by appending an adjusted return history of the oldest share class. Next, the Extended Performance Rating
is determined by comparing the adjusted-historical returns to the current open-end mutual fund universe to identify placement in the bell curve used to assign the Morningstar
Rating. Past performance is no guarantee of future results. ©2016 Morningstar, Inc. All Rights Reserved. The Information contained herein: (1) is proprietary to Morningstar
and/or its content providers; (2) may not be copied or distributed; and (3) is not warranted to be accurate, complete or timely. Neither Morningstar nor its content providers are
responsible for any damages or losses arising from any use of this information. Morningstar, Inc. has not granted consent for it to be considered or deemed an "expert" under
the Securities Act of 1933. Performance: Total return figures are net of fees and expenses, which includes a .25% distribution fee paid under rule 12b-1 for Advisor Shares only,
and reflect reinvestment of all dividends and distributions at net asset value. As described in the prospectus, during certain periods shown, the expenses borne by the Fund were
limited by the investment adviser; otherwise total return would have been lower. Index: The MSCI EAFE Index is a market weighted index composed of companies representative
of the market structure of certain developed companies located in Europe, Australasia and the Far East, and reflects the dividends net of nonrecoverable withholding tax.
Investors may not invest directly in an index. MSCI makes no express or implied warranties or representations and shall have no liability whatsoever with respect to any MSCI
data contained herein. The MSCI data may not be further redistributed or used as a basis for other indices or any securities or financial products. This report is not approved,
endorsed, reviewed or produced by MSCI. None of the MSCI data is intended to constitute any kind of investment decision and may not be relied on as such.
Sector/Securities: Securities holdings, sector and country breakdowns indicate characteristics as of a point in time and may not be representative of the Fund's current or future
investments. Portfolio sectors/securities and allocations are subject to change at any time and should not be viewed as a recommendation to buy/sell. Definitions: 1 Active share
represents the proportion of stock holdings in the fund that is different from the composition found in the benchmark. 2 An average that takes into account the proportional
relevance of each component, rather than treating each component equally. Market cap is the market price of an entire company on any given day, calculated by multiplying the
number of shares outstanding by the price per share. 3 Earnings growth is a measure of growth in a company's net income over a specific period. The term applies to actual
data from previous periods. 4 Standard deviation measures the risk or volatility of an investment's return over a particular time period; the greater the number, the greater the
risk. 5 Sharpe ratio is a risk-adjusted measure, calculated using standard deviation and excess return to determine reward per unit of risk; the higher the Sharpe ratio, the better
the fund's historical risk-adjusted performance. 6 Alpha is a measure of the difference between a fund's actual returns and its expected performance, given its level of risk as
measured by beta. 7 Beta measures the sensitivity of the fund to the movements of its benchmark. 8 R-squared measures the strength of the linear relationship between the
fund and its benchmark. R-squared at 1 implies perfect linear relationship and zero implies no relationship exists. Schroder Fund Advisors LLC, Member FINRA, SIPC – 875
Third Avenue, New York, NY 10022-6225 (800) 730-2932
FS-INTLALPHA

