Document 14147156
advertisement
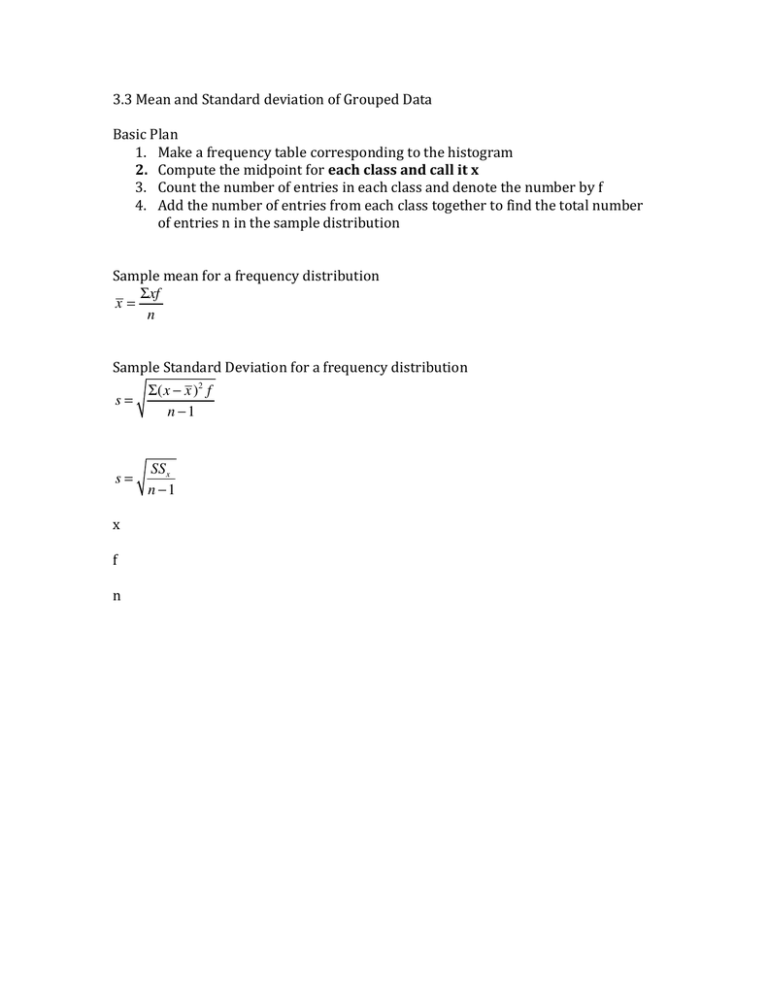
3.3 Mean and Standard deviation of Grouped Data Basic Plan 1. Make a frequency table corresponding to the histogram 2. Compute the midpoint for each class and call it x 3. Count the number of entries in each class and denote the number by f 4. Add the number of entries from each class together to find the total number of entries n in the sample distribution Sample mean for a frequency distribution Σxf x= n Sample Standard Deviation for a frequency distribution s= s= x f n Σ(x − x )2 f n −1 SSx n −1 The manager of a supermarket wants to hire one more checkout worker. To justify his request the manager chose a random sample of 50 customers and timed how long each stood in line before checking out. Class (Time in line) Frequency 0-­‐2 4 3-­‐5 3 6-­‐8 8 9-­‐11 15 12-­‐14 13 15-­‐17 5 18-­‐20 2 x − x x f xf (x − x )2 (x − x )2 f Σxw Weighted average = Σw Where w is the weight of the data value x.
