Performance Indicators - Q1 2006/7
advertisement
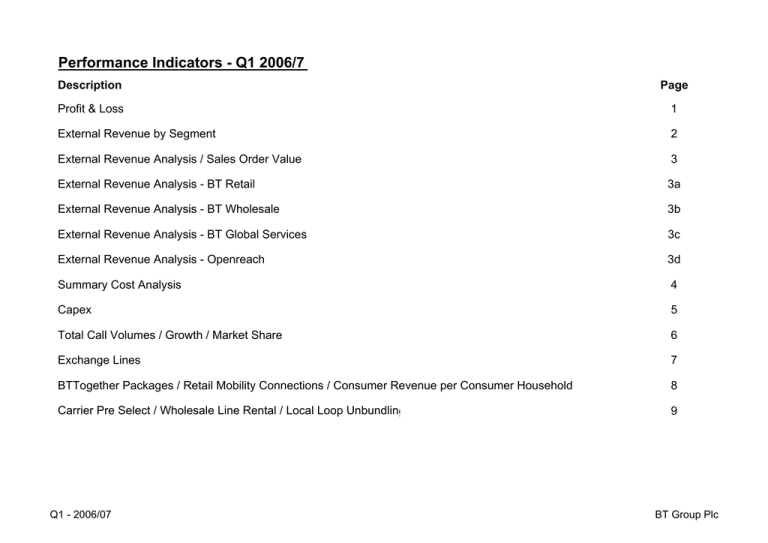
Performance Indicators - Q1 2006/7
Description
Page
Profit & Loss
1
External Revenue by Segment
2
External Revenue Analysis / Sales Order Value
3
External Revenue Analysis - BT Retail
3a
External Revenue Analysis - BT Wholesale
3b
External Revenue Analysis - BT Global Services
3c
External Revenue Analysis - Openreach
3d
Summary Cost Analysis
4
Capex
5
Total Call Volumes / Growth / Market Share
6
Exchange Lines
7
BTTogether Packages / Retail Mobility Connections / Consumer Revenue per Consumer Household
8
Carrier Pre Select / Wholesale Line Rental / Local Loop Unbundling
9
Q1 - 2006/07
BT Group Plc
BT Group Results
£m unless stated
Revenue
BT Retail
BT Wholesale
BT Global Services
Openreach
Other
Eliminations
Group Revenue
Leaver costs
EBITDA Inc. leaver costs
BT Retail
BT Wholesale
BT Global Services
Openreach
Other
Group EBITDA
2005/06
Q1
Restated
BT Group
2,120
1,814
2,067
1,294
6
(2,570)
4,731
6
Better /
(worse) vs
Pr Year
%
(2.5)
1.8
4.3
(2.7)
(16.7)
3.9
2.8
-
2006/07
Q1
Actual
BT Group
2005/06
Q2
Restated
BT Group
2005/06
Q3
Actual
Restated
2005/06
Q4
Restated
BT Group
2005/06
Full Year
Restated
BT Group
2,068
1,847
2,155
1,259
5
(2,470)
4,864
2,136
1,813
2,102
1,271
4
(2,559)
4,767
2,116
1,848
2,197
1,278
3
(2,560)
4,882
2,135
1,868
2,406
1,299
5
(2,579)
5,134
8,507
7,343
8,772
5,142
18
(10,268)
19,514
24
37
23
67
133
155
468
219
507
8
1,357
16.1
1.9
(3.7)
(7.3)
200.0
0.4
180
477
211
470
24
1,362
189
464
198
482
15
1,348
175
481
223
487
15
1,381
197
448
286
507
(7)
1,431
716
1,861
926
1,983
31
5,517
Depreciation & amortisation of intangibles
BT Retail
BT Wholesale
BT Global Services
Openreach
Other
Group Depreciation
34
271
152
186
66
709
(17.6)
(5.2)
2.6
5.9
16.7
0.8
40
285
148
175
55
703
39
274
158
188
33
692
36
271
160
196
47
710
38
286
168
230
51
773
147
1,102
638
800
197
2,884
Op Profit Inc. leaver costs
BT Retail
BT Wholesale
BT Global Services
Openreach
Other
Underlying Group Op Profit
121
197
67
321
(58)
648
15.7
(2.5)
6.0
8.1
46.6
1.7
140
192
63
295
(31)
659
150
190
40
294
(18)
656
139
210
63
291
(32)
671
159
162
118
277
(58)
658
569
759
288
1,183
(166)
2,633
(142)
5
511
(12)
499
(129)
4
25.2%
374
67.6
60.0
20.4
23.2
(17.1)
24.1
(46)
2
615
0
615
(151)
0
24.6%
464
(100)
3
559
(70)
489
(139)
21
24.9%
371
(129)
3
545
0
545
(134)
0
24.6%
411
4.5
4.4
8,471
716
8,121
24.4
27.3
0.1
4.9
5.6
5.6
8,314
715
7,727
5.0
4.4
4.30
8,456
694
8,133
4.9
4.9
(101)
5
562
(55)
507
(131)
16
23.3%
392
1
5.1
4.7
7.60
8,354
973
7,534
(472)
16
2,177
(137)
2,040
(533)
41
24.5%
1,548
1
19.5
18.4
11.90
8,422
3,142
7,534
Net Finance Costs
Share of post tax profits/losses of associates and joint ventures
Underlying PBT
Specific Items : Net gains (losses)
Reported PBT
Tax - Underlying
Tax on specific items
Tax rate
Net Income
Memo: Minority Interest
EPS before specific items
EPS after specific items
Proposed Dividend
Average Number of Shares in Issue
Capital Expenditure
Net Debt
Q1 - 2006/07
Page 1
8,407
759
8,113
BT Group plc
2004/5
EXTERNAL REVENUE BY
SEGMENT
Consumer
Major Corporate
Business
Wholesale / Global Carrier
Other
Total
2005/6
Q1
Q2
Q3
Q4
£m
1,416
1,391
617
1,088
7
4,519
£m
1,410
1,412
624
1,102
6
4,554
£m
1,400
1,440
600
1,090
6
4,536
£m
1,373
1,693
601
1,147
6
4,820
Total
£m
5,599
5,936
2,442
4,427
25
18,429
2006/7
Q1
Q2
Q3
Q4
Total
Q1
£m
1,324
1,597
586
1,218
6
4,731
£m
1,336
1,629
583
1,215
4
4,767
£m
1,324
1,732
568
1,255
3
4,882
£m
1,312
1,922
587
1,308
5
5,134
£m
5,296
6,880
2,324
4,996
18
19,514
£m
1,252
1,699
588
1,319
6
4,864
Q1
Q2
Q4
Total
(6.5%)
14.8%
(5.0%)
11.9%
n/m
4.7%
(5.2%)
15.4%
(6.6%)
10.3%
n/m
4.7%
Headline Year-on-Year Growth
EXTERNAL REVENUE BY
SEGMENT
Consumer
Major Corporate
Business
Wholesale / Global Carrier
Other
Total
2005/6
Q3
(5.4%)
20.3%
(5.3%)
15.1%
n/m
7.6%
(4.4%)
13.5%
(2.3%)
14.0%
n/m
6.5%
(5.4%)
15.9%
(4.8%)
12.9%
n/m
5.9%
2006/7
Q1
(5.4%)
6.4%
0.3%
8.3%
n/m
2.8%
Underlying Year-on-Year Growth - excluding impact of mobile termination and revenues from Infonet and Albacom (for 2005/6)
EXTERNAL REVENUE BY
SEGMENT
Consumer
Major Corporate
Business
Wholesale / Global Carrier
Other
Total
Q1 - 2006/07
Page 2
Q1
Q2
(4.9%)
4.2%
(2.8%)
16.8%
n/m
3.4%
(4.5%)
5.6%
(4.8%)
11.6%
n/m
2.5%
2005/6
Q3
(5.4%)
8.9%
(5.3%)
11.6%
n/m
3.2%
Q4
(4.4%)
8.9%
(2.3%)
13.6%
n/m
4.7%
Total
(4.8%)
7.0%
(3.8%)
13.4%
n/m
3.4%
2006/7
Q1
(5.4%)
6.4%
0.3%
8.3%
n/m
2.8%
BT Group Plc
2004/5
EXTERNAL REVENUE ANALYSIS BT Group
Q1
£m
Exchange lines/ISDN - connection and rental
Calls
Private Circuits
Transit, conveyance, interconnect circuits, WLR and
other wholesale (incl. FRIACO)
Other
Q2
£m
Q3
£m
2005/6
Q4
£m
Total
£m
Q1
£m
Q2
£m
Q3
£m
2006/7
Q4
£m
Total
£m
Q1
£m
918
982
326
959
888
325
952
820
325
934
799
316
3,763
3,489
1,292
921
764
314
912
749
302
889
730
322
881
713
302
3,603
2,956
1,240
876
685
309
657
700
650
699
619
685
599
726
2,525
2,810
630
717
634
731
636
698
655
732
2,555
2,878
661
692
3,583
3,521
3,401
3374
13,879
3,346
3,328
3,275
3283
13,232
3,223
Networked IT Services
Broadband and LLU
Mobility
Other
634
186
43
73
699
199
49
86
738
253
55
89
995
292
58
101
3,066
930
205
349
899
314
66
106
914
350
69
106
1,038
374
75
120
1,214
421
82
134
4,065
1,459
292
466
981
454
71
135
Total New Wave
936
1,033
1,135
1,446
4,550
1,385
1,439
1,607
1,851
6,282
1,641
4,519
4,554
4,536
4,820
18,429
4,731
4,767
4,882
5,134
19,514
4,864
31
31
41
42
39
40
162
79
110
79
110
158
199
147
189
164
203
164
204
633
795
Total Traditional
Total Revenue (Incl. Infonet and Albacom)
Memo: Infonet and Albacom in ext rev above - Traditional
for 2004/5 and 2005/6
Q1 - 2006/07
New Wave
Page 3
BT Group Plc
2004/5
EXTERNAL REVENUE ANALYSIS Retail
Exchange lines/ISDN - connection and rental
Calls
Private Circuits
Transit, conveyance, interconnect circuits, WLR and
other wholesale (incl. FRIACO)
Other
Q1
£m
Q2
£m
Q3
£m
2005/6
Q4
£m
Total
£m
Q1
£m
Q2
£m
Q3
£m
2006/7
Q4
£m
Total
£m
Q1
£m
752
875
43
801
787
47
795
729
48
780
710
35
3,128
3,101
173
766
678
41
754
664
41
741
650
41
736
631
35
2,997
2,623
158
719
603
34
266
277
272
254
1,069
260
272
257
253
1,042
251
1,936
1,912
1,844
1,779
7,471
1,745
1,731
1,689
1,655
6,820
1,607
Networked IT Services
Broadband and LLU
Mobility
Other
56
108
17
14
73
111
23
18
72
131
30
19
83
146
32
26
284
496
102
77
75
159
27
17
73
176
30
26
83
185
31
29
102
198
27
44
333
718
115
116
83
212
26
49
Total New Wave
195
225
252
287
959
278
305
328
371
1,282
370
Total External Revenue
2,131
2,137
2,096
2,066
8,430
2,023
2,036
2,017
2,026
8,102
1,977
Memo: Internal Revenue
53
68
64
83
268
97
100
99
109
405
91
2,184
2,205
2,160
2,149
8,698
2,120
2,136
2,116
2,135
8,507
2,068
Total Traditional
Total Retail Reported Revenue
Shading = not restated for proforma Openreach
Q1 - 2006/07
Page 3a - Retail
BT Group Plc
2004/5
EXTERNAL REVENUE ANALYSIS Wholesale
Q1
£m
Q2
£m
Q3
£m
2005/6
Q4
£m
Total
£m
Q1
£m
Q2
£m
Q3
£m
2006/7
Q4
£m
Total
£m
Q1
£m
Exchange lines/ISDN - connection and rental
Calls
Private Circuits
Transit, conveyance, interconnect circuits, WLR and
other wholesale (incl. FRIACO)
Other
154
155
155
167
631
161
150
169
158
638
158
657
-
650
-
619
-
599
-
2,525
-
587
-
587
-
575
-
582
-
2,332
-
574
-
Total Traditional
811
805
774
766
3,156
748
737
744
740
2,970
732
71
59
79
68
110
70
132
75
392
272
130
89
147
80
152
91
159
90
588
350
179
86
Total New Wave
130
147
180
207
664
219
227
243
249
938
265
Total External Revenue
941
952
954
973
3,820
967
964
987
989
3,908
997
Memo: Internal Revenue
1,332
1,311
1,318
1,314
5,275
847
849
861
879
3,435
850
Total Wholesale Reported Revenue
2,273
2,263
2,272
2,287
9,095
1,814
1,813
1,848
1,868
7,343
1,847
Networked IT Services
Broadband and LLU
Mobility
Other
Shading = not restated for proforma Openreach
Q1 - 2006/07
Page 3b - Wholesale
BT Group Plc
2004/5
EXTERNAL REVENUE ANALYSIS Global Services
2006/7
2005/6
Q1
£m
166
107
129
Q2
£m
158
101
123
Q3
£m
157
91
122
Q4
£m
154
89
114
Total
£m
635
388
488
Q1
£m
155
86
112
Q2
£m
158
85
111
Q3
£m
148
80
112
Q4
£m
145
82
109
Total
£m
606
333
444
Q1
£m
157
82
117
427
416
407
466
1,716
451
455
438
474
1,818
441
Total Traditional
829
798
777
823
3,227
804
809
778
810
3,201
797
Networked IT Services
Broadband and LLU
Mobility
Other
578
7
26
-
626
9
26
-
666
12
25
-
912
14
26
-
2,782
42
103
-
824
14
39
-
841
14
39
-
955
15
44
-
1,112
15
55
-
898
14
45
-
Total New Wave
611
661
703
952
2,927
877
894
1,014
1,182
3,732
58
177
3,967
1,440
1,459
1,480
1,775
6,154
1,681
1,703
1,792
1,992
7,168
1,754
287
332
330
385
1,334
386
399
405
414
1,604
401
1,727
1,791
1,810
2,160
7,488
2,067
2,102
2,197
2,406
8,772
2,155
Memo: Infonet and Albacom in Ext rev above - Traditional
31
31
41
42
39
40
162
for 2004/5 and 2005/6
79
79
158
147
164
164
633
110
110
199
189
203
204
795
Q3
£m
1,194
8,103
Q4
£m
1,086
5,391
Exchange lines/ISDN - connection and rental
Calls
Private Circuits
Transit, conveyance, interconnect circuits, WLR and
other wholesale (incl. FRIACO)
Other
Total Revenue (Incl. Infonet and Albacom)
Memo: Internal Revenue
Total Global Services Reported Revenue
New Wave
957
Shading = not restated for proforma Openreach
SOLUTIONS AND C&SI SALES ORDER VALUE
Total order intake
Rolling 12 months order intake
Q1 - 2006/07
Q1
£m
1,276
6,240
Q2
£m
852
6,531
2004/5
Q3
£m
1,235
5,688
Q4
£m
3,798
7,161
Page 3c - Global Services
Q1
£m
2,359
8,244
2005/6
Q2
£m
752
8,144
2006/7
Q1
£m
1,041
4,073
BT Group Plc
2004/5
EXTERNAL REVENUE ANALYSIS Openreach
Exchange lines/ISDN - connection and rental
Calls
Private Circuits
Transit, conveyance, interconnect circuits, WLR and
other wholesale (incl. FRIACO)
Other
Q1
£m
Q2
£m
2005/6
Q3
£m
Q4
£m
Total
£m
Q1
£m
Q2
£m
2006/7
Q3
£m
Q4
£m
Total
£m
Q1
£m
-
-
-
-
-
-
-
-
-
-
-
-
-
-
-
-
42
-
47
-
61
-
73
-
223
-
81
-
42
47
61
73
223
81
11
-
13
-
22
-
49
-
49
-
Total New Wave
11
13
22
49
95
95
Total Revenue
53
60
83
122
318
130
Memo: Internal Revenue
1,241
1,211
1,195
1,177
4,824
1,129
Total Openreach Reported Revenue
1,294
1,271
1,278
1,299
5,142
1,259
Total Traditional
Networked IT Services
Broadband and LLU
Mobility
Other
-
-
-
-
-
49
Shading = not restated for proforma Openreach
Q1 - 2006/07
Page 3d - Openreach
BT Group Plc
2004/5
Summary Cost Analysis
Staff costs before leaver costs
Leaver costs
Staff costs (including leaver costs)
Other operating costs
Own work capitalised
Sub total
POLO's
Depreciation and amortisation
Amortisation of acquired intangibles
Total costs*
Q1
£m
1,070
102
1,172
1,285
(172)
2,285
988
700
3,973
Q2
£m
1,065
8
1,073
1,371
(206)
2,238
964
704
3,906
Q3
£m
1,098
12
1,110
1,370
(169)
2,311
880
695
3,886
2006/7
2005/6
Q4
£m
1,155
44
1,199
1,502
(175)
2,526
893
745
4,164
Total
£m
4,388
166
4,554
5,528
(722)
9,360
3,725
2,844
15,929
Q1
£m
1,156
6
1,162
1,436
(191)
2,407
1,009
706
3
4,125
Q2
£m
1,210
37
1,247
1,444
(208)
2,483
989
690
2
4,164
Q3
£m
1,226
23
1,249
1,520
(246)
2,523
1,032
707
3
4,265
Q4
£m
1,241
67
1,308
1,713
(255)
2,766
1,015
770
3
4,554
Total
£m
4,833
133
4,966
6,113
(900)
10,179
4,045
2,873
11
17,108
Q1
£m
1,256
24
1,280
1,519
(253)
2,546
1,006
700
3
4,255
* Under IFRS basis and before specific items
Q1 - 2006/07
Page 4
BT Group Plc
Capex by Line of Business
BT Retail
Q1
Q2
£m
£m
31
41
2004/5
Q3
Q4
£m
44
£m
54
Total
Q1
2005/6
Q2
Q3
£m
£m
£m
170
Openreach
£m
35
33
32
257
247
Q4
Total
2006/7
Q1
£m
£m
£m
53
153
40
270
265 1,039
271
Access
Switch
Transmission
Products/Systems Support
BT Wholesale
269
30
45
133
477
274
25
50
199
548
268
31
73
142
514
225
14
62
141
442
1,036
100
230
615
1,981
20
10
32
168
230
20
8
39
130
197
19
9
35
158
221
22
5
33
266
326
81
32
139
722
974
16
2
20
162
200
Solutions and C&SI
UK Networks
Other
BT Global Services
47
37
60
144
61
35
65
161
66
24
51
141
86
25
48
159
260
121
224
605
51
27
64
142
49
32
90
171
55
23
91
169
61
33
126
220
216
115
371
702
53
24
72
149
42
53
71
89
255
52
46
67
109
274
55
694
803
770
744
3,011
716
694
759
973 3,142
715
Others (includes Fleet and Property)
Total
Shading = not restated for proforma Openreach
Q1 - 2006/07
Page 5
BT Group Plc
Total Fixed Network Calls
Quarterly Minutes (billions)
Jun-03 Sep-03 Dec-03 Mar-04 Jun-04 Sep-04 Dec-04 Mar-05
Jun-05
Sep-05
Dec-05
Mar-06
Jun-06
Internet Related and Other Non Geo
Fixed to Mobile
Total Non Geographic Calls
13.94
2.37
16.31
13.06
2.37
15.43
12.51
2.29
14.79
12.45
2.26
14.70
10.93
2.21
13.13
10.13
2.20
12.33
9.33
2.13
11.46
8.68
2.08
10.76
7.51
2.13
9.64
6.86
2.08
8.94
6.20
2.02
8.22
5.87
1.99
7.86
5.00
1.99
6.99
Local
National
International
Total Geographic
12.04
6.14
0.56
18.74
11.67
6.09
0.55
18.31
11.89
6.07
0.56
18.51
11.78
6.09
0.55
18.43
10.61
5.53
0.52
16.66
10.34
5.51
0.52
16.37
10.42
5.46
0.52
16.40
10.15
5.33
0.50
15.98
9.53
5.09
0.49
15.11
9.02
4.90
0.48
14.40
9.15
4.87
0.47
14.49
9.01
4.87
0.47
14.35
8.20
4.47
0.45
13.12
Total Retail
35.04
33.74
33.30
33.13
29.79
28.70
27.86
26.74
24.75
23.34
22.71
22.21
20.11
Freephone and FRIACO
23.20
22.10
22.23
23.64
20.88
18.55
16.71
15.84
12.83
9.90
8.38
7.16
5.96
BT Group Originating Calls*
58.24
55.84
55.54
56.77
50.67
47.25
44.57
42.58
37.58
33.24
31.09
29.37
26.07
Quarterly Year on Year Minutes Change
Jun-03 Sep-03 Dec-03 Mar-04 Jun-04 Sep-04 Dec-04 Mar-05
Jun-05
Sep-05
Dec-05
Mar-06
Jun-06
Internet Related and Other Non Geo
Fixed to Mobile
Total Non Geographic Calls
(11)%
5%
(9)%
(12)%
1%
(10)%
(16)%
(2)%
(14)%
(16)%
(2)%
(14)%
(22)%
(7)%
(19)%
(22)%
(7)%
(20)%
(25)%
(7)%
(23)%
(30)%
(8)%
(27)%
(31)%
(4)%
(27)%
(32)%
(6)%
(27)%
(34)%
(5)%
(28)%
(32)%
(4)%
(27)%
(33)%
(7)%
(28)%
Local
National
International
Total Geographic
(7)%
(7)%
(3)%
(7)%
(8)%
(8)%
(3)%
(8)%
(10)%
(9)%
(3)%
(9)%
(8)%
(7)%
(4)%
(7)%
(12)%
(10)%
(7)%
(11)%
(11)%
(10)%
(6)%
(11)%
(12)%
(10)%
(7)%
(11)%
(14)%
(12)%
(9)%
(13)%
(10)%
(8)%
(6)%
(9)%
(13)%
(11)%
(7)%
(12)%
(12)%
(11)%
(9)%
(12)%
(11)%
(9)%
(8)%
(10)%
(14)%
(12)%
(8)%
(13)%
Total Retail
(8)%
(9)%
(11)%
(11)%
(15)%
(15)%
(16)%
(19)%
(17)%
(19)%
(18)%
(17)%
(19)%
Freephone and FRIACO
29%
18%
7%
3%
(10)%
(16)%
(25)%
(33)%
(39)%
(47)%
(50)%
(55)%
(54)%
BT Group Originating Calls*
4%
0%
(5)%
(5)%
(13)%
(15)%
(20)%
(25)%
(26)%
(30)%
(30)%
(31)%
(31)%
* Excluding Payphones and Directories (c0.3bn mins/qtr)
Total Fixed Network Calls
Fixed to Fixed Voice Market Share *
FY 04
FY 05
FY 06
Residential
70%
64%
58%
Business
44%
42%
41%
* BT annual estimates: Local, national, international and non-geographic voice minute
Q1 - 2006/07
Page 6
BT Group Plc
Exchange Lines ('000)
Product Group Summary
Jun-03
Sep-03
Dec-03
Mar-04
Jun-04
Sep-04
Dec-04
Mar-05
Jun-05
Sep-05
Dec-05
Mar-06
Jun-06
Retail
Business Voice
Business ISDN
Business Broadband
Major Corporate Broadband
Total Business
5,539
3,519
158
20
9,236
5,483
3,528
184
26
9,221
5,395
3,524
218
33
9,170
5,324
3,500
247
40
9,111
5,260
3,476
272
47
9,055
5,148
3,452
297
55
8,952
5,043
3,413
343
65
8,864
4,976
3,382
366
75
8,799
4,895
3,311
390
83
8,679
4,789
3,254
416
90
8,549
4,735
3,207
448
99
8,489
4,645
3,152
481
103
8,381
4,558
3,100
507
106
8,271
Residential Voice
Residential ISDN
Residential Broadband
Total Residential
19,716
280
378
20,374
19,679
264
455
20,398
19,683
243
578
20,504
19,649
221
680
20,550
19,554
198
783
20,535
19,497
170
931
20,598
19,467
140
1,101
20,708
19,405
115
1,339
20,859
19,086
93
1,508
20,687
18,701
74
1,661
20,436
18,360
61
1,863
20,284
17,863
49
2,084
19,996
17,219
41
2,213
19,473
Total Voice
Total ISDN
Total Broadband (incl. Major Corporates)
25,255
3,799
556
25,162
3,792
665
25,078
3,767
829
24,973
3,721
967
24,814
3,674
1,102
24,645
3,622
1,283
24,510
3,553
1,509
24,381
3,497
1,780
23,981
3,404
1,981
23,490
3,328
2,167
23,095
3,268
2,410
22,508
3,201
2,668
21,777
3,141
2,826
Total Retail Lines
29,610
29,619
29,674
29,661
29,590
29,550
29,572
29,658
29,366
28,985
28,773
28,377
27,744
1,058
1,339
1,753
2,215
2,687
3,294
4,182
5,023
5,713
6,348
7,078
7,760
8,071
BT Wholesale
BT Wholesale Broadband Connections
Broadband numbers adjusted from Dec-04. This is due to all data now being sourced from equivalent BT Wholesale systems
and also from the inclusion of BT own use and test lines
Q1 - 2006/07
Page 7
BT Group Plc
BT Together Packages ('000)
Jun-03
Sep-03 Dec-03 Mar-04
Jun-04 Sep-04
Dec-04
Mar-05
Jun-05
Sep-05
Dec-05
Mar-06
Jun-06
Total
8,873
8,934
8,956
8,859
8,991
17,617
17,599
17,560
17,268
16,914
16,609
16,158
15,563
Option 1
Option 2
Option 3
BTT Local
5,100
1,087
82
2,604
5,255
1,173
210
2,296
5,379
1,220
274
2,083
5,419
1,218
324
1,898
5,609
1,250
433
1,699
14,270
1,269
515
1,563
14,314
1,290
556
1,439
14,326
1,317
582
1,335
14,119
1,344
582
1,223
13,836
1,387
575
1,116
13,600
1,409
573
1,027
13,192
1,442
586
938
12,630
1,478
598
857
BT Mobility Connections ('000)
Jun-03
Sep-03 Dec-03 Mar-04
Jun-04 Sep-04
Dec-04
Mar-05
Jun-05
Sep-05
Dec-05
Mar-06
Jun-06
Total
57
70
106
145
215
305
341
372
370
350
334
341
337
Business
Consumer
51
6
59
11
82
24
104
41
127
88
144
161
162
179
185
187
196
174
204
146
209
125
214
127
219
118
Average Revenue per Consumer Household *
Jun-03
Dec-04
Mar-05
Jun-05
Sep-05
Dec-05
Mar-06
Jun-06
£
Sep-03 Dec-03 Mar-04
£
£
£
Jun-04 Sep-04
£
£
£
£
£
£
£
£
£
Annual revenue
272
270
268
266
265
261
258
254
252
251
250
251
253
Contracted**
56%
57%
57%
58%
59%
60%
62%
64%
65%
66%
67%
67%
68%
Non-contracted
44%
43%
43%
42%
41%
40%
38%
36%
35%
34%
33%
33%
32%
* Rolling 12 month consumer revenue, less mobile polos, divided by average number of primary lines
** Includes line rental, broadband, select services and packages.
Q1 - 2006/07
Page 8
BT Group Plc
CPS Volumes ('000)
Jun-03 Sep-03 Dec-03
Number of users*
Net adds in quarter
Mar-04
Jun-04
Sep-04
Dec-04
Mar-05
Jun-05
Sep-05
Dec-05
Mar-06
Jun-06
1,622
2,120
2,725
3,299
3,723
4,169
4,571
4,909
5,291
5,554
5,779
6,067
6,335
578
498
605
574
424
446
402
338
382
263
225
288
268
* CPS numbers include those customers who have migrated from Indirect Access
External WLR ('000)
Jun-03 Sep-03 Dec-03
Analogue lines /
ISDN Channels
121
180
291
Mar-04
Jun-04
Sep-04
Dec-04
Mar-05
Jun-05
Sep-05
Dec-05
Mar-06
Jun-06
377
491
630
825
1,026
1,450
1,882
2,333
2,874
3,557
External LLU Volumes ('000)
Jun-03 Sep-03 Dec-03
Full and Shared
loops
Q1 - 2006/07
6
8
8
Mar-04
Jun-04
Sep-04
Dec-04
Mar-05
Jun-05
Sep-05
Dec-05
Mar-06
Jun-06
11
14
20
28
41
72
122
192
356
580
Page 9
BT Group Plc
