Proceedings of the Twenty-Fifth AAAI Conference on Artificial Intelligence
Can Collective Sentiment Expressed on
Twitter Predict Political Elections?
Jessica Chung∗ and Eni Mustafaraj
Computer Science Department
Wellesley College
jchung, emustafa@wellesley.edu
Coakley
#tweets
%
52,116 53.86
Abstract
Research examining the predictive power of social media (especially Twitter) displays conflicting results, particularly in
the domain of political elections. This paper applies methods
used in studies that have shown a direct correlation between
volume/sentiment of Twitter chatter and future electoral results in a new dataset about political elections. We show that
these methods display a series of shortcomings, that make
them inadequate for determining whether social media messages can predict the outcome of elections.
Brown
#tweets
%
44,654 46.14
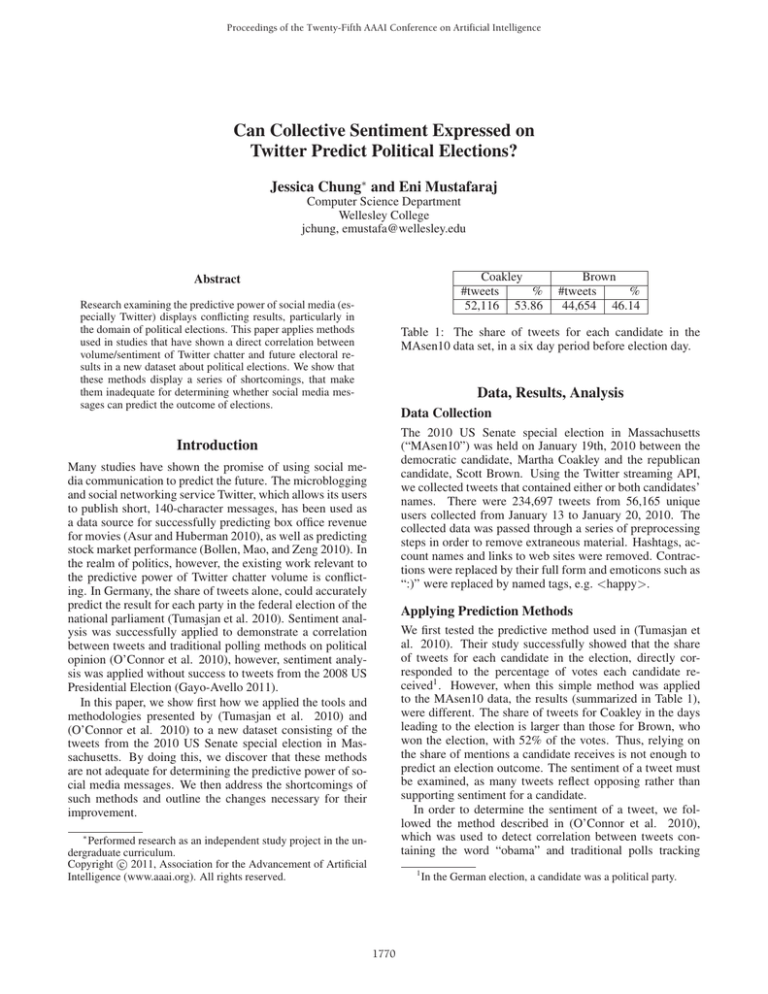
Table 1: The share of tweets for each candidate in the
MAsen10 data set, in a six day period before election day.
Data, Results, Analysis
Data Collection
The 2010 US Senate special election in Massachusetts
(“MAsen10”) was held on January 19th, 2010 between the
democratic candidate, Martha Coakley and the republican
candidate, Scott Brown. Using the Twitter streaming API,
we collected tweets that contained either or both candidates’
names. There were 234,697 tweets from 56,165 unique
users collected from January 13 to January 20, 2010. The
collected data was passed through a series of preprocessing
steps in order to remove extraneous material. Hashtags, account names and links to web sites were removed. Contractions were replaced by their full form and emoticons such as
“:)” were replaced by named tags, e.g. <happy>.
Introduction
Many studies have shown the promise of using social media communication to predict the future. The microblogging
and social networking service Twitter, which allows its users
to publish short, 140-character messages, has been used as
a data source for successfully predicting box office revenue
for movies (Asur and Huberman 2010), as well as predicting
stock market performance (Bollen, Mao, and Zeng 2010). In
the realm of politics, however, the existing work relevant to
the predictive power of Twitter chatter volume is conflicting. In Germany, the share of tweets alone, could accurately
predict the result for each party in the federal election of the
national parliament (Tumasjan et al. 2010). Sentiment analysis was successfully applied to demonstrate a correlation
between tweets and traditional polling methods on political
opinion (O’Connor et al. 2010), however, sentiment analysis was applied without success to tweets from the 2008 US
Presidential Election (Gayo-Avello 2011).
In this paper, we show first how we applied the tools and
methodologies presented by (Tumasjan et al. 2010) and
(O’Connor et al. 2010) to a new dataset consisting of the
tweets from the 2010 US Senate special election in Massachusetts. By doing this, we discover that these methods
are not adequate for determining the predictive power of social media messages. We then address the shortcomings of
such methods and outline the changes necessary for their
improvement.
Applying Prediction Methods
We first tested the predictive method used in (Tumasjan et
al. 2010). Their study successfully showed that the share
of tweets for each candidate in the election, directly corresponded to the percentage of votes each candidate received1 . However, when this simple method was applied
to the MAsen10 data, the results (summarized in Table 1),
were different. The share of tweets for Coakley in the days
leading to the election is larger than those for Brown, who
won the election, with 52% of the votes. Thus, relying on
the share of mentions a candidate receives is not enough to
predict an election outcome. The sentiment of a tweet must
be examined, as many tweets reflect opposing rather than
supporting sentiment for a candidate.
In order to determine the sentiment of a tweet, we followed the method described in (O’Connor et al. 2010),
which was used to detect correlation between tweets containing the word “obama” and traditional polls tracking
∗
Performed research as an independent study project in the undergraduate curriculum.
c 2011, Association for the Advancement of Artificial
Copyright Intelligence (www.aaai.org). All rights reserved.
1
1770
In the German election, a candidate was a political party.
sb and sc
ob and oc
n
Positive
461
180
254
Negative
114
191
110
Neutral
432
209
266
Accuracy
45.78%
31.03%
40.32%
sb and sc
ob and oc
n
Table 2: Confusion matrix for OpinionMiner classifier.
Positive
711
253
254
Negative
86
176
110
Neutral
233
151
266
Accuracy
69.03%
30.34%
40.32%
Table 3: Confusion matrix for SentiWordNet classifier.
President Obama’s 2009 job approval ratings. Their sentiment analysis method used the subjectivity lexicon from
OpinionFinder (Wilson, Wiebe, and Hoffmann 2005), a
wordlist containing 2,800 words that are manually annotated
as positive, negative, neutral or both. We implemented their
algorithm, that finds which words in a tweet have a label in
the lexicon, and calculates the overall sentiment of a tweet
based on the sum of polarities for distinct words. The algorithm is then applied to a subset of MAsen10 data, which
was manually labeled with the following labels: supports
Brown (sb), supports Coakley (sc), opposes Brown (ob), opposes Coakley (oc) and neutral (n). To avoid a common pitfall of social media analysis (a small number of users contribute the majority of content), we tried to create a “one vote
per resident” scenario. Thus, the labeled subset consists of
2325 tweets from Twitter users who had indicated their location as Massachusetts and who only posted once during the
data collection period. We consider all tweets with the label
(sb) and (sc) as positive, and those with labels (oc) and (ob)
as negative. That way, we can build the confusion matrix in
Table 2, which shows how the automatic labeling (positive,
negative, neutral) fared compared to the manual labels.
The overall accuracy is 41.41%, better than a random
classifier, but not reliable for predictions. This low accuracy can be explained with the low coverage of our dataset
from the OpinionFinder lexicon (less then 40%). To improve
coverage, we tested another lexical resource, SentiWordNet
3.0 (Esuli and Sebastiani 2006). SentiWordNet consists of
over 207,000 word-sense pairs; many words have several
parts-of-speech (POS) and these words can also have multiple senses. Since we do not take POS into account (because
of the poor grammar of tweets), we created a dictionary that
takes all #1 senses of a word and if a word has more positive senses, it is positive and vice versa. We then reapply the
sentiment analysis classifier based on this new lexicon, and
results are shown in Table 3.
While the SentiWordNet lexicon improves coverage to
80%, its accuracy (47.19%) is not a great improvement over
the OpinionFinder classifier. The tweets displayed below are
examples of the limitations of using SentiWordNet.
(1) is incorrectly classified because ’glad’ and ’won’ incorrectly appear in SentiWordNet as negative words.
(2) is incorrectly classified due to lack of POS-tagging
and stemming.
(3) is incorrectly due to a lack of word sense disambiguation; ’really’ can be a synonym for ’truly’, however, here it
is used to express incredulity. Furthermore, the use of uppercase and punctuation also express sentiment.
Lastly, (4) is an example of a tweet, which does not contain any polar words at all. The only indication of this
tweet’s polarity is the use of the exclamation mark.
Conclusions
We have shown that current simple methods for predicting
election results based on sentiment analysis of tweets text
are no better than random classifiers. In order to improve
the accuracy of sentiment analysis, it is needed to go beyond
methods that rely on words polarity alone. Pre-processing
techniques such as POS tagging and word sense disambiguation might be necessary, as well as non-lexical features.
Lastly, we need a way to learn the polarity of words in the
context and domain in which they appear.
References
(1)I’m glad that Scott Brown won. We’ll see what he can do!
(’glad’, ’-’), (’scott’, ’n’), (’won’, ’-’), (’see’, ’n’)
(2) here’s to hoping martha coakley loses in two days
(’two’, ’n’), (’days’, ’n’)
(3) How is this POSSIBLE?! Scott Brown? Really, MA?
You let me down.
(’possible’, ’+’), (’scott’, ’n’), (’really’, ’+’),
(’let’, ’n’)
(4) Scott Brown came to Wachusett this weekend! <url>
(’scott’, ’n’), (’weekend’, ’n’)
1771
Asur, S., and Huberman, B. A. 2010. Predicting the future with social media. CoRR abs/1003.5699. http:
//arxiv.org/abs/1003.5699.
Bollen, J.; Mao, H.; and Zeng, X.-J. 2010. Twitter mood
predicts the stock market. CoRR abs/1010.3003. http:
//arxiv.org/abs/1010.3003.
Esuli, A., and Sebastiani, F. 2006. Sentiwordnet: A publicly
available lexical resource for opinion mining. In Proc. of the
5th LREC06, 417–422.
Gayo-Avello, D. 2011. A warning against converting social
media into the next literary digest. In CACM (to appear).
O’Connor, B.; Balasubramanyan, R.; Routledge, B. R.; and
Smith, N. A. 2010. From tweets to polls: Linking text sentiment to public opinion time series. In Proc. of 4th ICWSM,
122–129. AAAI Press.
Tumasjan, A.; Sprenger, T.; Sandner, P. G.; and Welpe, I. M.
2010. Predicting elections with twitter: What 140 characters
reveal about political sentiment. In Proc. of 4th ICWSM,
178–185. AAAI Press.
Wilson, T.; Wiebe, J.; and Hoffmann, P. 2005. Recognizing contextual polarity in phrase-level sentiment analysis.
Proceedings of HLT/EMNLP.


