the usage guide - Social Market Analytics
advertisement
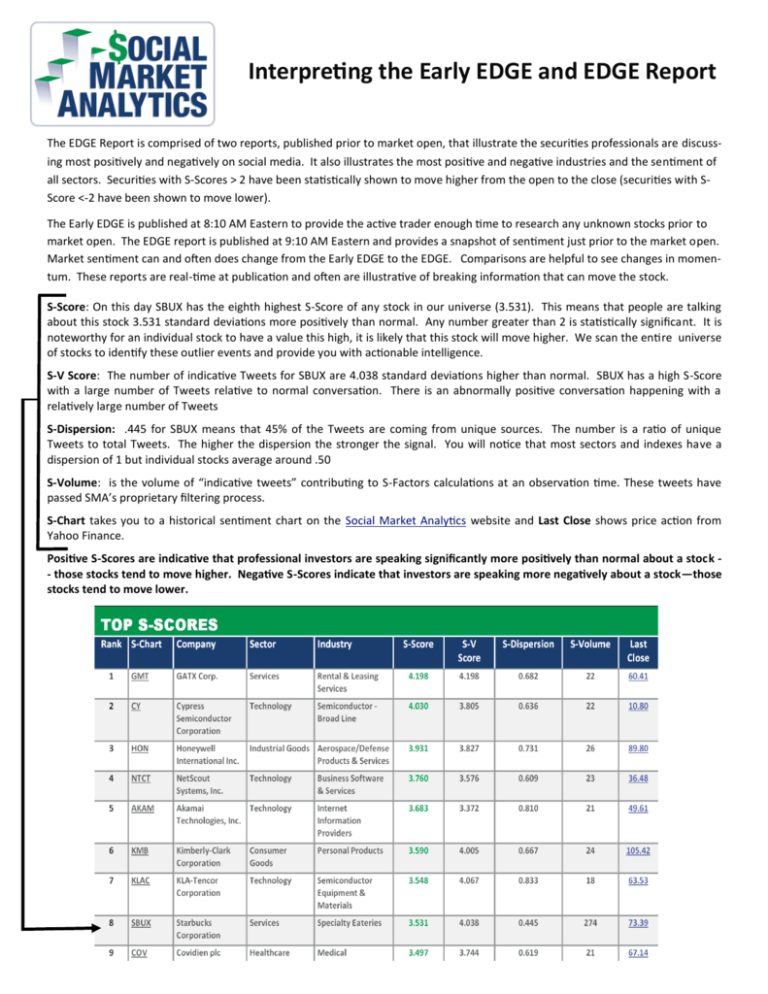
Interpreting the Early EDGE and EDGE Report The EDGE Report is comprised of two reports, published prior to market open, that illustrate the securities professionals are discussing most positively and negatively on social media. It also illustrates the most positive and negative industries and the sentiment of all sectors. Securities with S-Scores > 2 have been statistically shown to move higher from the open to the close (securities with SScore <-2 have been shown to move lower). The Early EDGE is published at 8:10 AM Eastern to provide the active trader enough time to research any unknown stocks prior to market open. The EDGE report is published at 9:10 AM Eastern and provides a snapshot of sentiment just prior to the market open. Market sentiment can and often does change from the Early EDGE to the EDGE. Comparisons are helpful to see changes in momentum. These reports are real-time at publication and often are illustrative of breaking information that can move the stock. S-Score: On this day SBUX has the eighth highest S-Score of any stock in our universe (3.531). This means that people are talking about this stock 3.531 standard deviations more positively than normal. Any number greater than 2 is statistically significant. It is noteworthy for an individual stock to have a value this high, it is likely that this stock will move higher. We scan the entire universe of stocks to identify these outlier events and provide you with actionable intelligence. S-V Score: The number of indicative Tweets for SBUX are 4.038 standard deviations higher than normal. SBUX has a high S-Score with a large number of Tweets relative to normal conversation. There is an abnormally positive conversation happening with a relatively large number of Tweets S-Dispersion: .445 for SBUX means that 45% of the Tweets are coming from unique sources. The number is a ratio of unique Tweets to total Tweets. The higher the dispersion the stronger the signal. You will notice that most sectors and indexes have a dispersion of 1 but individual stocks average around .50 S-Volume: is the volume of “indicative tweets” contributing to S-Factors calculations at an observation time. These tweets have passed SMA’s proprietary filtering process. S-Chart takes you to a historical sentiment chart on the Social Market Analytics website and Last Close shows price action from Yahoo Finance. Positive S-Scores are indicative that professional investors are speaking significantly more positively than normal about a stock - those stocks tend to move higher. Negative S-Scores indicate that investors are speaking more negatively about a stock—those stocks tend to move lower.

