SIMON FRASER UNIVERSITY Department of Economics Econ 305 Prof. Kasa
advertisement
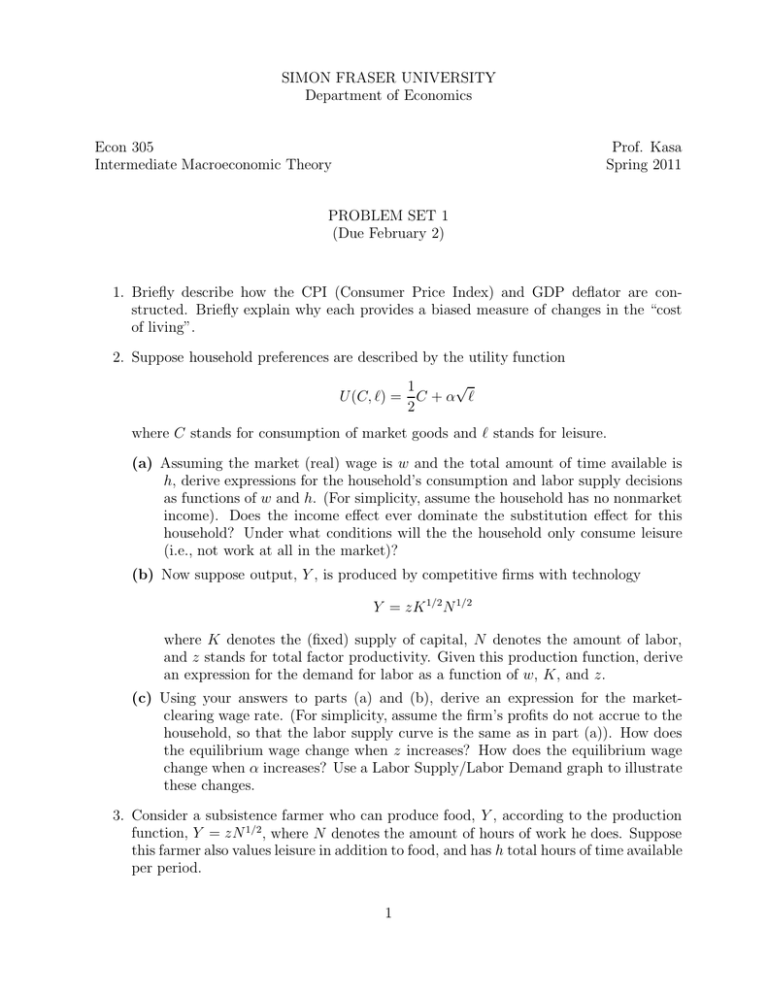
SIMON FRASER UNIVERSITY Department of Economics Econ 305 Intermediate Macroeconomic Theory Prof. Kasa Spring 2011 PROBLEM SET 1 (Due February 2) 1. Briefly describe how the CPI (Consumer Price Index) and GDP deflator are constructed. Briefly explain why each provides a biased measure of changes in the “cost of living”. 2. Suppose household preferences are described by the utility function √ 1 U (C, `) = C + α ` 2 where C stands for consumption of market goods and ` stands for leisure. (a) Assuming the market (real) wage is w and the total amount of time available is h, derive expressions for the household’s consumption and labor supply decisions as functions of w and h. (For simplicity, assume the household has no nonmarket income). Does the income effect ever dominate the substitution effect for this household? Under what conditions will the the household only consume leisure (i.e., not work at all in the market)? (b) Now suppose output, Y , is produced by competitive firms with technology Y = zK 1/2N 1/2 where K denotes the (fixed) supply of capital, N denotes the amount of labor, and z stands for total factor productivity. Given this production function, derive an expression for the demand for labor as a function of w, K, and z. (c) Using your answers to parts (a) and (b), derive an expression for the marketclearing wage rate. (For simplicity, assume the firm’s profits do not accrue to the household, so that the labor supply curve is the same as in part (a)). How does the equilibrium wage change when z increases? How does the equilibrium wage change when α increases? Use a Labor Supply/Labor Demand graph to illustrate these changes. 3. Consider a subsistence farmer who can produce food, Y , according to the production function, Y = zN 1/2, where N denotes the amount of hours of work he does. Suppose this farmer also values leisure in addition to food, and has h total hours of time available per period. 1 (a) Draw the farmer’s production possibilities frontier, and use it illustrate his optimal choice of food and leisure. (For simplicity, ignore the fact that there might be some minimum amount of food required to live!). (b) Now suppose a factory opens up nearby, giving him the opportunity to work for a fixed wage rate, which he can then use to buy his food in the town market. Draw a picture illustrating the minimum wage required to induce him to leave farming and work in the factory. Assuming a farmer decides to take a job in a factory, does he work more or less than before? (c) Do you think this picture has any relevance for developing countries like China? 4. Suppose Jane gets paid $10 per hour for the first 8 hours of work, and $15 for each hour of overtime (i.e., in excess of 8 hours). Assume Jane can decide her own hours, and decides to work 10 hours. Now suppose her employer changes the compensation policy, and decides to pay a fixed wage of $11 per hour. Will Jane work more or less than before? Use the concepts of income and substitution effects to explain your answer. Use a graph to illustrate your answer. 2
